Analyse-it includes Deming regression and Weighted Deming regression so you can compare two analytical methods to determine bias (systematic error). Unlike linear regression, Deming regression allows measurement error (imprecision) in both the X and Y variables so is ideal for comparing clinical methods.
- Useful for robust implementation of CLSI EP9-A2 [6] method comparison guideline.
- Supports Deming regression [1, 3] – so you can compare methods with constant precision (constant SD) over the measurement range.
- Supports Weighted Deming regression [2] – so you can compare methods with non-constant precision (constant CV%) over the measurement range.
Flexible experiment design
- Supports any number of observations.
- Supports methods measured in singlicate, duplicate or any number of replicates.
- Specify imprecision (as a SD or %CV or relative ratio) for methods measured in singlicate[4] (imprecision automatically determined for methods measured in replicate).
- Compare methods using the mean of replicates, 1st replicate only, or the 1st replicate of the test method against mean of reference method replicates.
Statistics and charts you need
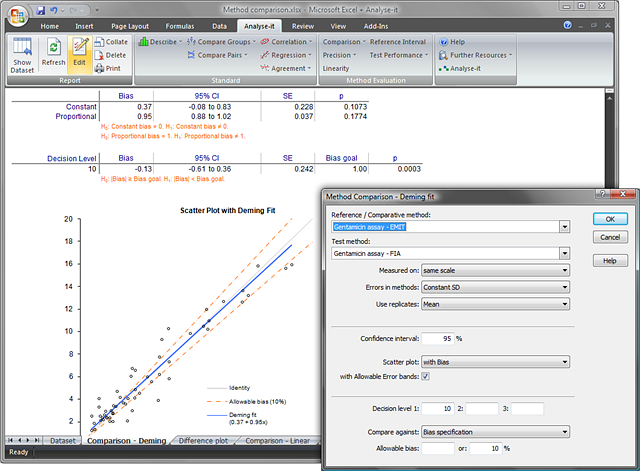
- Systematic error as constant and proportional bias, both with confidence intervals -- easily identify the source of bias so you can then take action to correct it.
- Imprecision (repeatability) for methods measured in replicate – essential to get the most accurate estimate of bias on which to make reliable decisions [4].
- Scatter plot with Deming fitted regression line, confidence bands, identity line and equation – so you can visualize the observations, bias, likely range of bias, and see how well the methods agree.
- Standardized residual plot – so you can easily spot outliers, check precision over the range of measurement, and identify non-linearity.
- Syx –an independent estimate of the method’s precision so you can identify whether matrix effects are present, inflating the imprecision.
Verify bias is within an allowable error goal
- Specify allowable error goal directly or as a percentage of Total Allowable Error (TAe).
- Express allowable error goal directly, or Total Allowable Error (TAe), as an absolute concentration (e.g. 5mg/dL), percentage of concentration (e.g. 10%), or combination (e.g. 10%, with minimum of 5mg/dL).
- Scatter plot with allowable error bands – so you can clearly see if, and at what concentration levels, bias exceeds the allowable error goal.
Determine bias at important clinical decision levels
- Specify up to 3 decision levels
- Calculates bias with confidence intervals – so you can see the bias at clinically important decision points and judge its affect on clinical decision-making.
- Hypothesis test for bias against goal at specified decision levels– tells you if the observed bias at the decision level is outside the allowable error goal.
Reliable algorithms you can trust
Analyse-it uses the latest algorithms from widely respected international journals. Cornbleet and Gochman[1] is used to calculate Deming regression, and the latest iteratively re-weighted procedure described by Linnet [3] is used to calculate Weighted Deming regression. Standard errors and confidence intervals use the jack-knife method [3].
- Incorrect Least-Squares Regression Coefficients in Method-Comparison Analysis. P. Joanne Cornbleet, Nathan Gochman, Clin Chem. Vol 25 No. 13 1979; 432-437
- Estimation of the Linear Relationship between the Measurements of Two Methods with Proportional Errors. Kristian Linnet, Statistics in Medicine Vol 9 1990; 1463-1473
- Evaluation of Regression Procedures for Method Comparison Studies. Kristian Linnet, Clin.Chem. Vol. 39 No. 3 1993; 424-432
- Performance of Deming Regression Analysis in the Case of Mis-specified Analytical Error Ratio in Method Comparison Studies. Kristian Linnet,Clin Chem. Vol 44 No. 5 1998; 1024-1031
- Necessary Sample Size for Method Comparison Studies Based on Regression Analysis. Kristian Linnet, Clin Chem. Vol 45 No. 6 1999; 882-894
- Method Comparison and Bias Estimation Using Patient Samples; Approved Guideline – Second Edition. CLSI document EP9-A2 [ISBN 1-65238-472-4]
