Method validation and verification.
Analyse-it includes Passing Bablok regression so you can compare two analytical methods to determine bias (systematic error). Unlike linear regression, Passing Bablok regression is ideal for comparing clinical methods because it allows measurement error (imprecision) in both the X and Y variables, does not assume measurement error is normally distributed, and is robust against outliers.
- Useful for robust implementation of CLSI EP9-A2 [4] method comparison guideline.
- Supports Passing Bablok method comparison regression [1] – so you can compare methods exhibiting constant precision (constant SD) or non-constant precision (constant CV) over the measurement range.
- Supports Passing & Bablok method conversion regression [3] – so you can convert between methods measured on different measurement scales.
Flexible experiment design
- Supports any number of observations.
- Supports methods measured in singlicate, duplicate or any number of replicates.
- Compare methods using the mean of replicates, 1st replicate only, or the 1st replicate of the test method against mean of reference method replicates.
Statistics and charts you need
- Systematic error as constant and proportional bias, both with confidence intervals -- easily identify the source of bias so you can then take action to correct it.
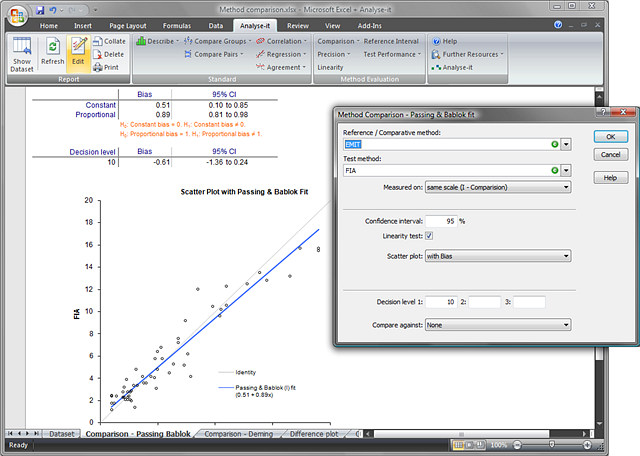
- Scatter plot with Passing-Bablok fitted regression line, confidence bands, identity line and equation – so you can visualise the observations, bias, likely range of bias, and see how well the methods agree.
- Residual plot – so you can easily spot outliers, check precision over the range of measurement, and identify non-linearity.
- Linearity plot with cusum linearity test – so you can easily identify non-linearity.
Verify bias is within an allowable error goal
- Specify allowable error goal directly or as a percentage of Total Allowable Error (TAe).
- Express allowable error goal directly, or Total Allowable Error (TAe), as an absolute concentration (e.g. 5mg/dL), percentage of concentration (e.g. 10%), or combination (e.g. 10%, with minimum of 5mg/dL).
- Scatter plot with allowable error bands – so you can clearly see if, and at what concentration levels, bias exceeds the allowable error goal.
Determine bias at important clinical decision levels
- Specify up to 3 decision levels
- Calculates bias with confidence intervals – so you can see the bias at clinically important decision points and judge its affect on clinical decision-making.
- Hypothesis test for bias against goal at specified decision levels– tells you if the observed bias at the decision level is outside the allowable error goal.
Reliable algorithms you can trust
Analyse-it uses the latest algorithms from widely respected international journals, including Passing Bablok regression [1, 2, 3] for method comparison and method conversion.
- New Biometrical Procedure for Testing the Equality of Measurements from Two Different Analytical Methods H. Passing, W. Bablok, J. Clin. Chem. Biochem. Vol 21 No. 11 1983; 709-720
- Comparison of Several Regression Procedures for Method Comparison Studies and Determination of Sample Sizes H. Passing, W. Bablok, J. Clin. Chem. Biochem. Vol 22 No. 6 1984; 431-445
- A General Regression Procedure for Method Transformation H. Passing, W. Bablok, J. Clin. Chem. Biochem. Vol 26 No. 11 1988; 783-790
- Method Comparison and Bias Estimation Using Patient Samples; Approved Guideline – Second Edition. CLSI document EP9-A2 [ISBN 1-65238-472-4]
