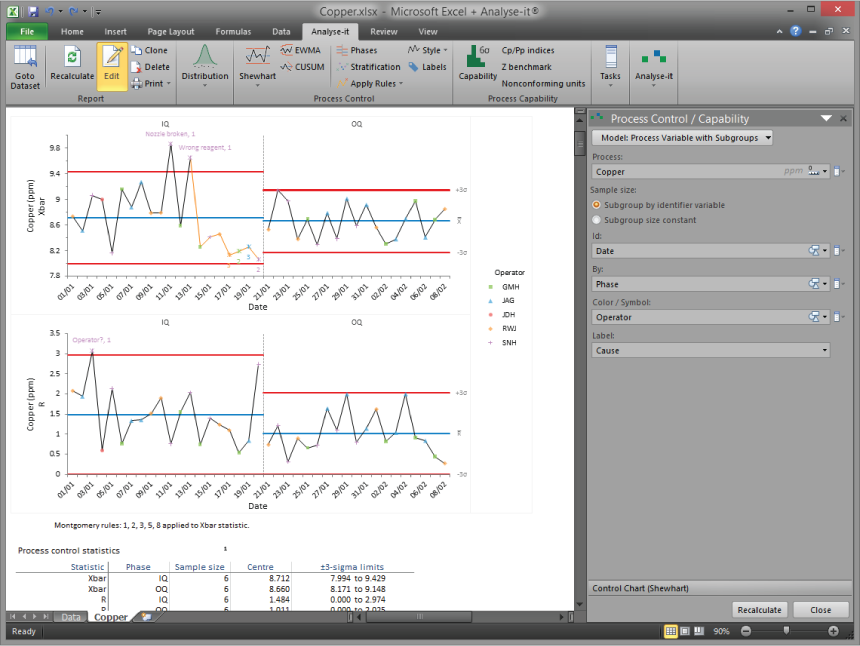
Control chart software for process monitoring Shewhart variable and attribute charts, CUSUM, EWMA, and UWMA time-weighted charts — with WECO, Nelson, and Montgomery detection rules, phases for before-and-after comparison, and stratification to identify contributing sources of variation.
Try free for 15 days — no credit card required
![]()
Trusted by 75,000 researchers, analysts, and scientists at leading universities, hospitals, and companies worldwide — for over 30 years.
Every chart type you need
Shewhart variable charts (Xbar-R, Xbar-S, I-MR), attribute charts (p, np, c, u), and time-weighted charts (CUSUM, EWMA, UWMA) — all in one package. For continuous measurements, defect counts, and detecting small sustained shifts.
Detection rules that do the work
WECO, Nelson, and Montgomery rules applied automatically — not just points beyond control limits. Runs, trends, stratification, and oscillation patterns flagged without manual inspection of every chart.
Phases and stratification
Separate control limits for before and after a process change. Stratify by operator, shift, machine, or any factor to identify contributing sources of variation that aggregate charts hide.
A control chart without detection rules is just a time series plot with lines on it. The value of a proper control chart is that it distinguishes special cause variation from common cause variation — and does so automatically, using established statistical rules, not visual judgment. Most basic implementations plot the data against control limits and leave the interpretation to you. Analyse-it applies WECO, Nelson, or Montgomery detection rules automatically, flagging runs, trends, stratification patterns, and oscillation as well as points beyond the limits. The difference is between a chart that shows you the data and a chart that tells you when to act.
Analyse-it includes every Shewhart chart type for continuous and attribute data. Variable charts — Xbar-R, Xbar-S, Xbar, R, S, I-MR, I, and MR — for continuous measurements where the distribution and subgroup size determine the appropriate chart. Attribute charts — p, np, c, and u — for defective items, defects per unit, and count data. Time-weighted CUSUM, EWMA, and UWMA charts for detecting small, sustained shifts in the process mean that Shewhart charts are less sensitive to — particularly useful in processes where small drifts accumulate into significant problems before a Shewhart chart signals.
Phases let you set separate control limits for periods before and after a process change, so you can see the effect of an improvement without historical data pulling the limits in the wrong direction. Stratification overlays a factor — operator, shift, machine, material lot — onto the chart so that patterns invisible in aggregate data become visible. These are the features that make control charts useful for process improvement, not just process monitoring, and they are the features most basic tools leave out.
75,000 professionals at leading companies, hospitals, and laboratories worldwide have relied on Analyse-it for over 30 years.
What's included
-
Monitor continuous data with variable charts
Shewhart Xbar-R, Xbar-S, Xbar, R, S, I-MR, I, and MR charts. Choose the chart appropriate for your subgroup size and data structure. Control limits calculated from the data or specified from a known standard.
-
Track defects and defectives with attribute charts
Shewhart p, np, c, and u charts for pass/fail inspection data, defect counts, and defectives per unit. The same detection rules and phasing capabilities available for variable charts.
-
Detect small shifts with time-weighted charts
CUSUM (cumulative sum), EWMA (exponentially weighted moving average), and UWMA (uniformly weighted moving average) charts. Designed to detect small, sustained shifts in the process mean that Shewhart charts are less sensitive to.
-
Flag out-of-control conditions automatically
WECO, Nelson, and Montgomery detection rule sets applied automatically. Points beyond control limits, runs above or below the centre line, trends, stratification, and oscillation patterns — all flagged without manual chart inspection.
-
Compare performance before and after changes
Phases with separate control limits for each period. See the effect of a process change directly on the chart, with limits recalculated for the new operating conditions rather than diluted by historical data.
-
Identify hidden sources of variation
Stratify by operator, shift, machine, material lot, or any factor. Patterns that are invisible in aggregate data — one shift consistently higher, one machine more variable — become immediately visible.
-
Part of the QC and Improvement edition
Control charts are part of the QC and Improvement edition, which also covers process capability analysis (Cp, Cpk, Pp, Ppk, Cpm, Z-benchmark), Pareto analysis, hypothesis tests, and regression — the complete DMAIC statistical workflow in one package.
Trusted by 75,000 researchers, analysts, and scientists at leading universities, hospitals, and companies worldwide — for over 30 years.
Try free for 15 days — no credit card required