Process capability analysis software Cp, Cpk, Pp, Ppk, Cpm, Z-benchmark, and sigma level — with confidence intervals, non-normal data handling, and the control charts you need to confirm process stability before capability indices mean anything.
Try free for 15 days — no credit card required
![]()
Trusted by 75,000 researchers, analysts, and scientists at leading universities, hospitals, and companies worldwide — for over 30 years.
Capability and performance indices
Cp, Cpl, Cpu, Cpk, Cpm, Pp, Ppl, Ppu, Ppk — all with confidence intervals. Z-benchmark and sigma level for Six Sigma programmes. Nonconforming unit estimation to quantify the practical impact on yield.
Non-normal data handled properly
Capability indices on non-normal data produce meaningless numbers. Box-Cox and other power transformations bring non-normal distributions into a form where the indices are valid. Normal Q-Q plot to assess whether transformation is needed and whether it worked.
Confirm stability before measuring capability
Capability analysis only makes sense for a stable process. Analyse-it includes control charts and capability analysis in the same package — confirm the process is in control first, then assess capability in the same workbook.
A capability index on an out-of-control process is a meaningless number. A capability index on non-normal data is a misleading number. Both are common mistakes, and both happen more easily when the control chart and the capability analysis live in separate tools — it becomes tempting to skip the stability check, or to run the indices without assessing the distribution first. The most important thing a capability tool can do is make the right workflow easy: confirm stability, check the distribution, transform if necessary, then calculate the indices.
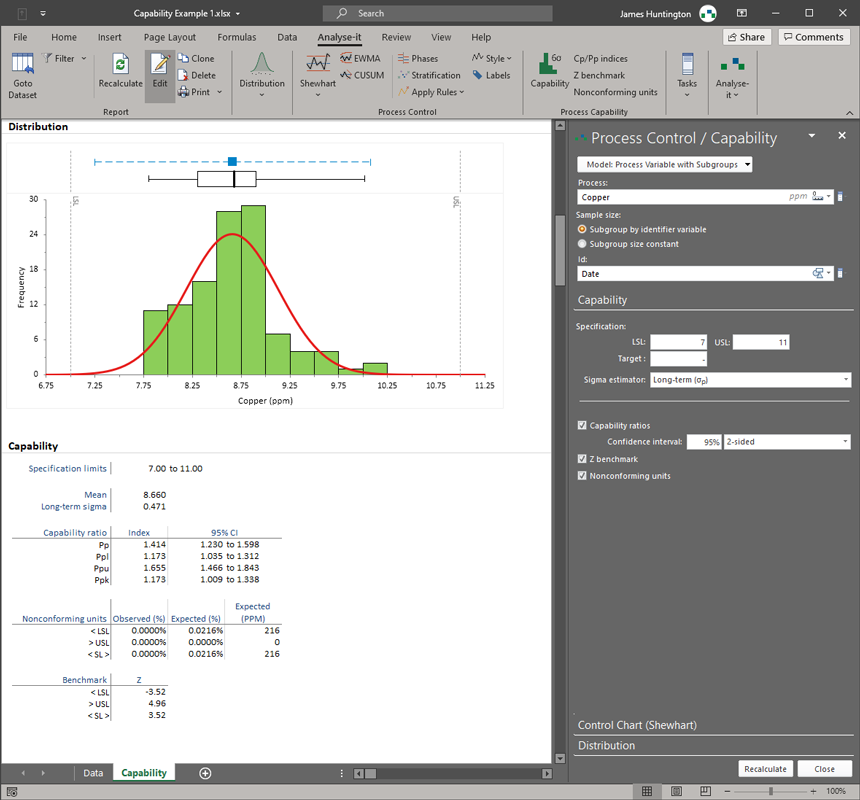
Analyse-it includes both control charts and capability analysis in the same package. Run the Shewhart chart, confirm the process is in control using WECO, Nelson, or Montgomery detection rules, then switch to capability analysis in the same workbook. The histogram with specification limits and normal Q-Q plot with Lilliefors confidence band are included as standard for every capability analysis, so the distributional check is part of the workflow rather than an extra step. When the data is non-normal — which is common in real production — Box-Cox and other power transformations are right there, with a Q-Q plot of the transformed data to verify the transformation worked.
Analyse-it reports both capability and performance indices. Cp, Cpl, Cpu, Cpk, and Cpm measure inherent process capability using within-subgroup variation — what the process can deliver when it is operating in control. Pp, Ppl, Ppu, and Ppk measure actual delivered performance using total process variation — what the process has actually delivered over time. The distinction matters: a process with good Cpk but poor Ppk has capability that isn't being realised, which points to special cause variation that needs investigation. Z-benchmark, sigma level, and nonconforming unit estimation complete the picture for Six Sigma programmes. All indices are reported with confidence intervals.
75,000 professionals at leading companies, hospitals, and laboratories worldwide have relied on Analyse-it for over 30 years.
What's included
-
Determine whether your process meets the specification
Capability indices Cp, Cpl, Cpu, Cpk, and Cpm — measuring inherent process capability using within-subgroup variation. All reported with confidence intervals so you know the precision of the estimate, not just the point value.
-
Measure actual delivered performance
Performance indices Pp, Ppl, Ppu, and Ppk — using total process variation to reflect what the process has actually delivered over time. Compare with capability indices to identify whether special cause variation is eroding potential performance.
-
Quantify yield impact for Six Sigma programmes
Z-benchmark (short-term and long-term) and sigma level calculated directly from the data. Nonconforming unit estimation — parts per million and percentage — for both lower and upper specification limits.
-
Handle non-normal distributions correctly
Histogram with specification limits and normal Q-Q plot with Lilliefors confidence band for every analysis. Box-Cox and other power transformations for non-normal data, with Q-Q plot of transformed data to verify effectiveness.
-
Confirm stability before calculating capability
Shewhart variable and attribute control charts with WECO, Nelson, and Montgomery detection rules — in the same package. Confirm the process is in control before running capability analysis, in the same workbook, without transferring data.
-
Part of the QC and Improvement edition
Capability analysis is part of the QC and Improvement edition, which also covers Shewhart, CUSUM, and EWMA control charts, Pareto analysis, hypothesis tests, and regression — the complete DMAIC statistical workflow in one package.
Trusted by 75,000 researchers, analysts, and scientists at leading universities, hospitals, and companies worldwide — for over 30 years.
Try free for 15 days — no credit card required