Trusted by 75,000 scientists at thousands of laboratories and 8 of the top-10 leading IVD manufacturers for over 30 years.
![]()
![]()
![]()
![]()
![]()
![]()
![]()
![]()
Analyse-it is developed for and is in use at thousands of ISO/IEC 17025 accredited testing and calibration laboratories, ISO 15189 accredited medical laboratories, CLIA ’88 regulated medical laboratories, and IVD manufacturers for development, support, product labelling and FDA 510(k) submissions.
Establish precision, linearity, bias, detection capability, and interferences during product development. Compare your method against a predicate or reference procedure. Establish reference intervals and diagnostic accuracy for product labelling. Verify manufacturer claims when bringing a new analyser or reagent system into clinical use. Produce the statistical evidence for a 510(k) submission, CE-IVD technical file, CAP inspection, or ISO 15189 audit.
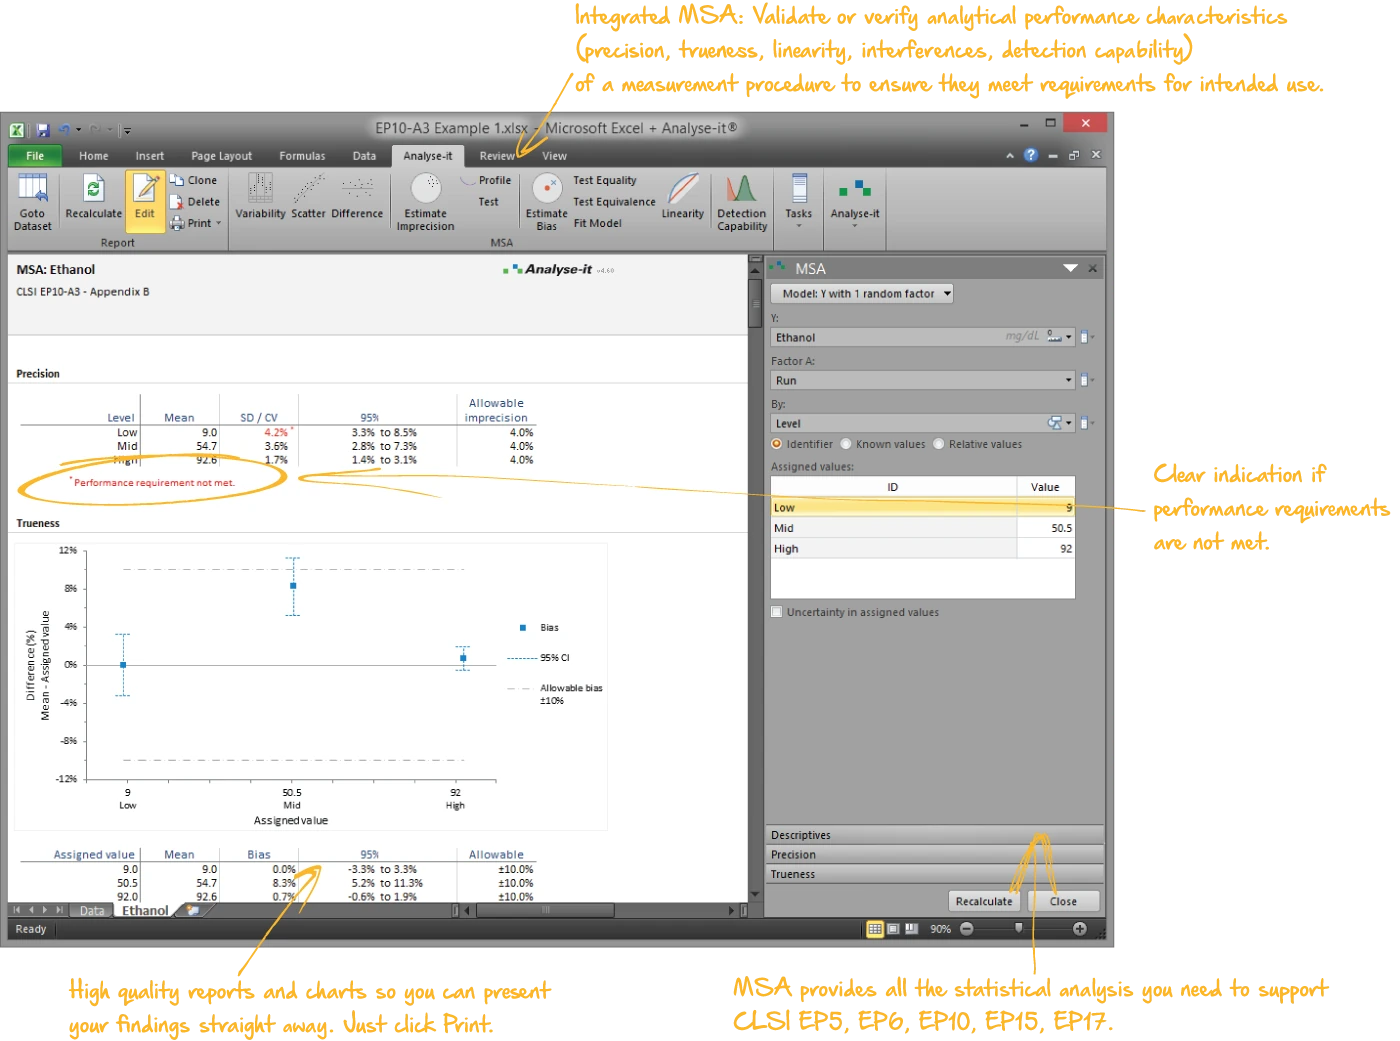
Establish the precision, trueness, linearity, interferences, and detection capability of a measurement procedure — whether you’re an IVD manufacturer characterising performance during development for a 510(k) submission, or a clinical laboratory verifying manufacturer claims:
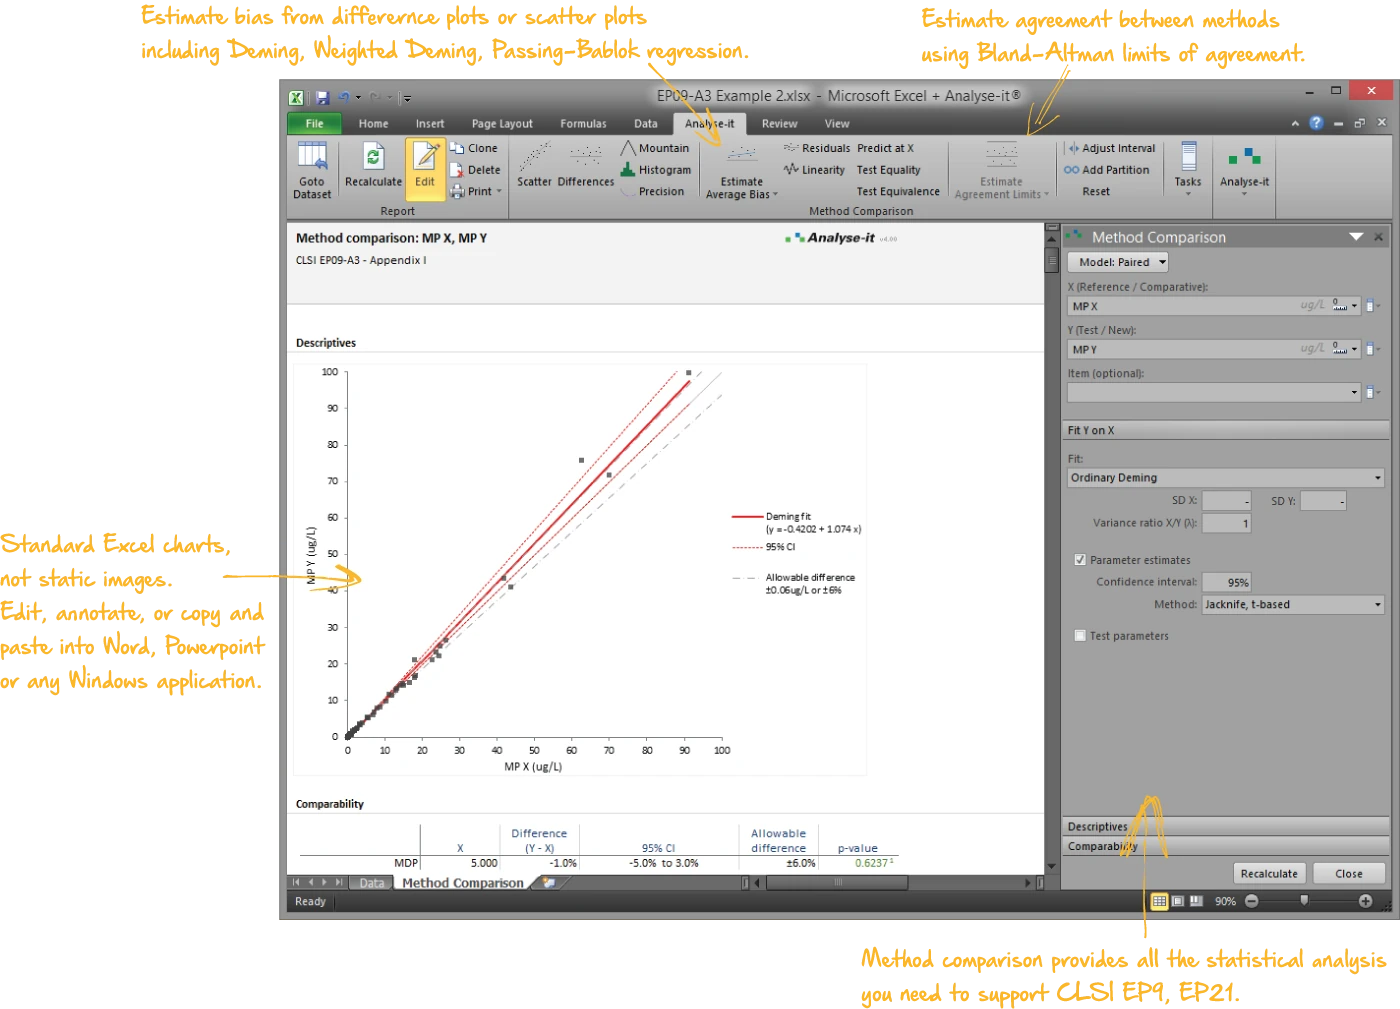
When introducing a new measurement procedure, replacing an existing one, or comparing against a reference method, you need to know the bias and whether it affects clinical decisions:
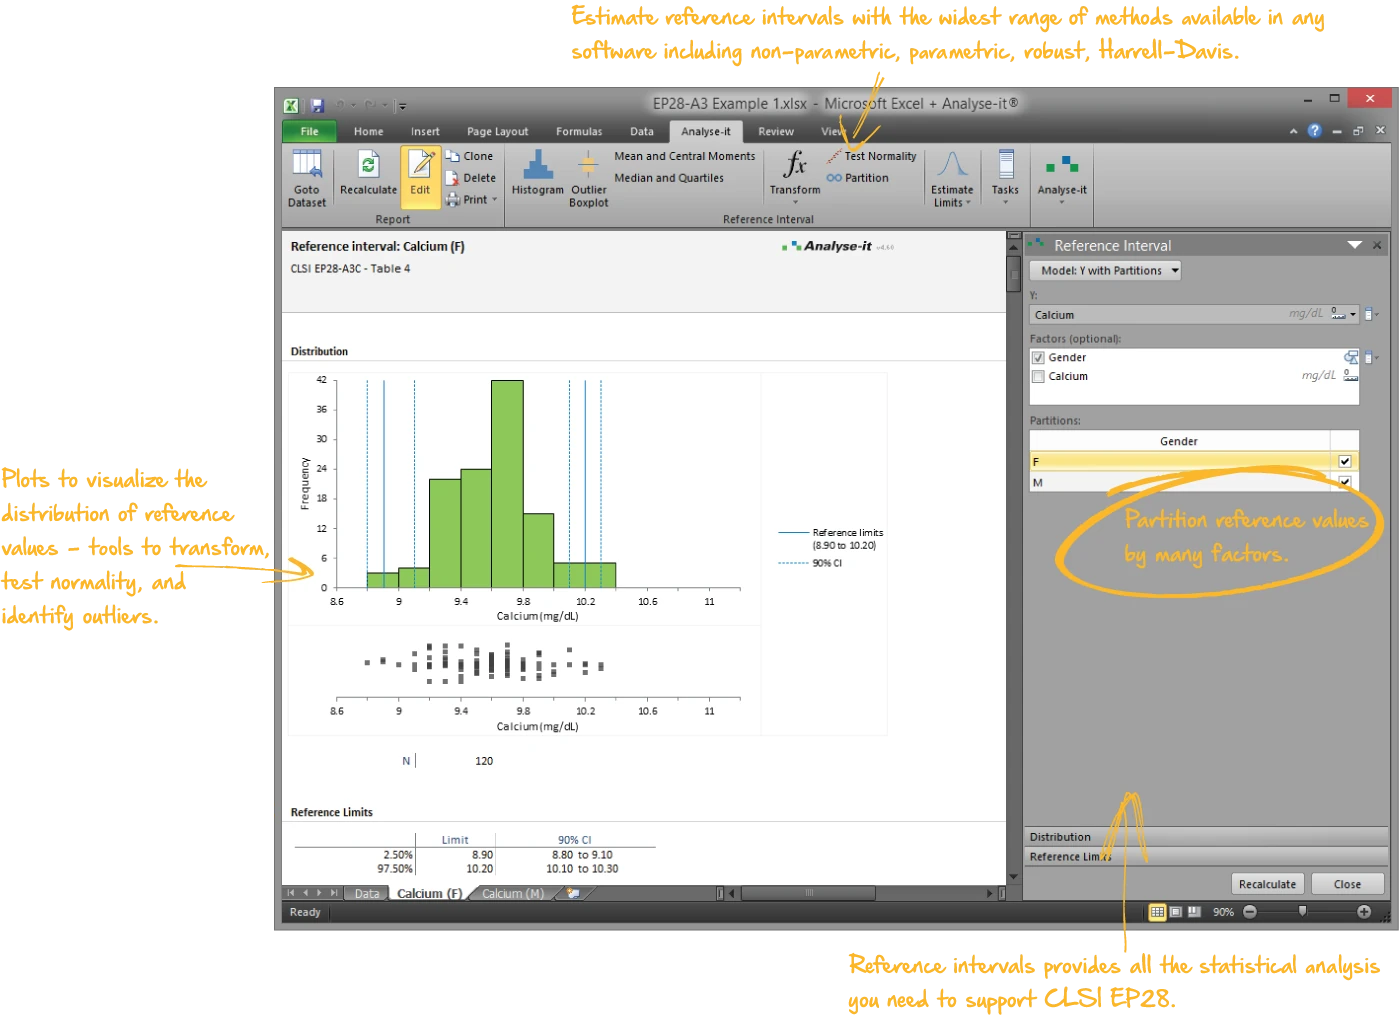
Reference intervals are essential for clinicians to interpret results and make a diagnosis. Analyse-it covers the full EP28-A3C workflow — from choosing the right quantile method for your data and sample size, through outlier screening and partitioning, to transfer and verification against a new procedure or population.
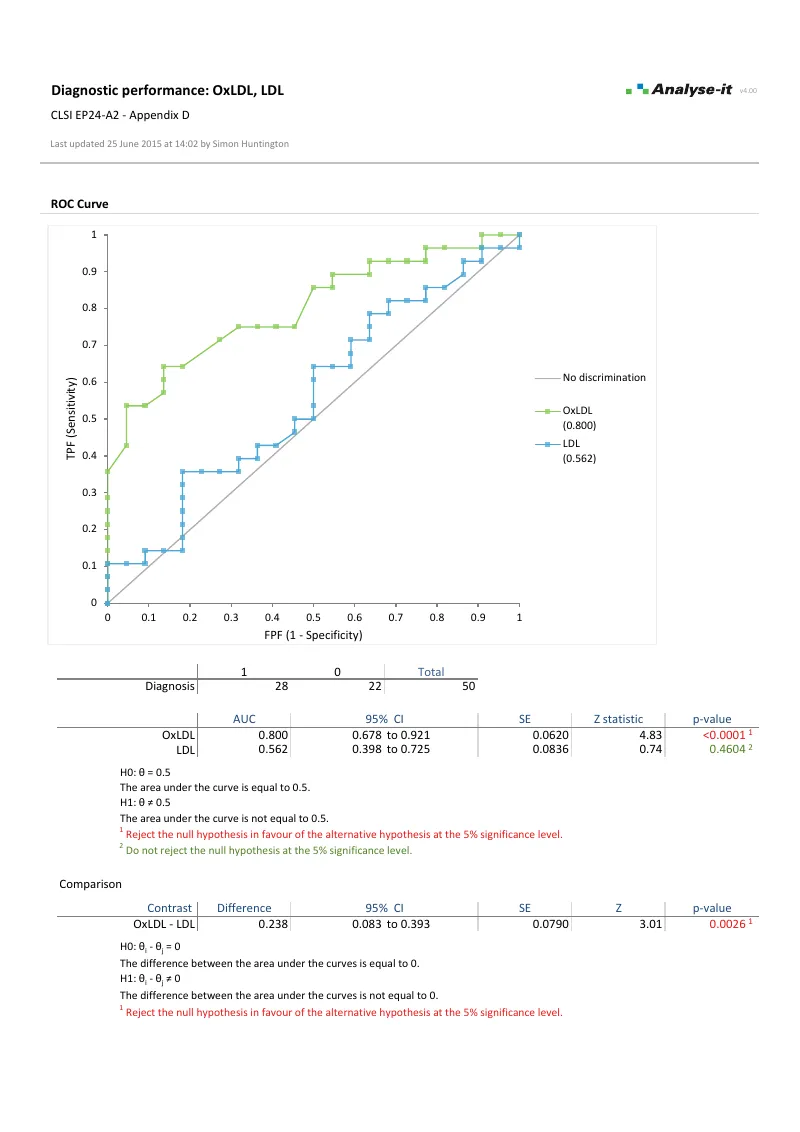
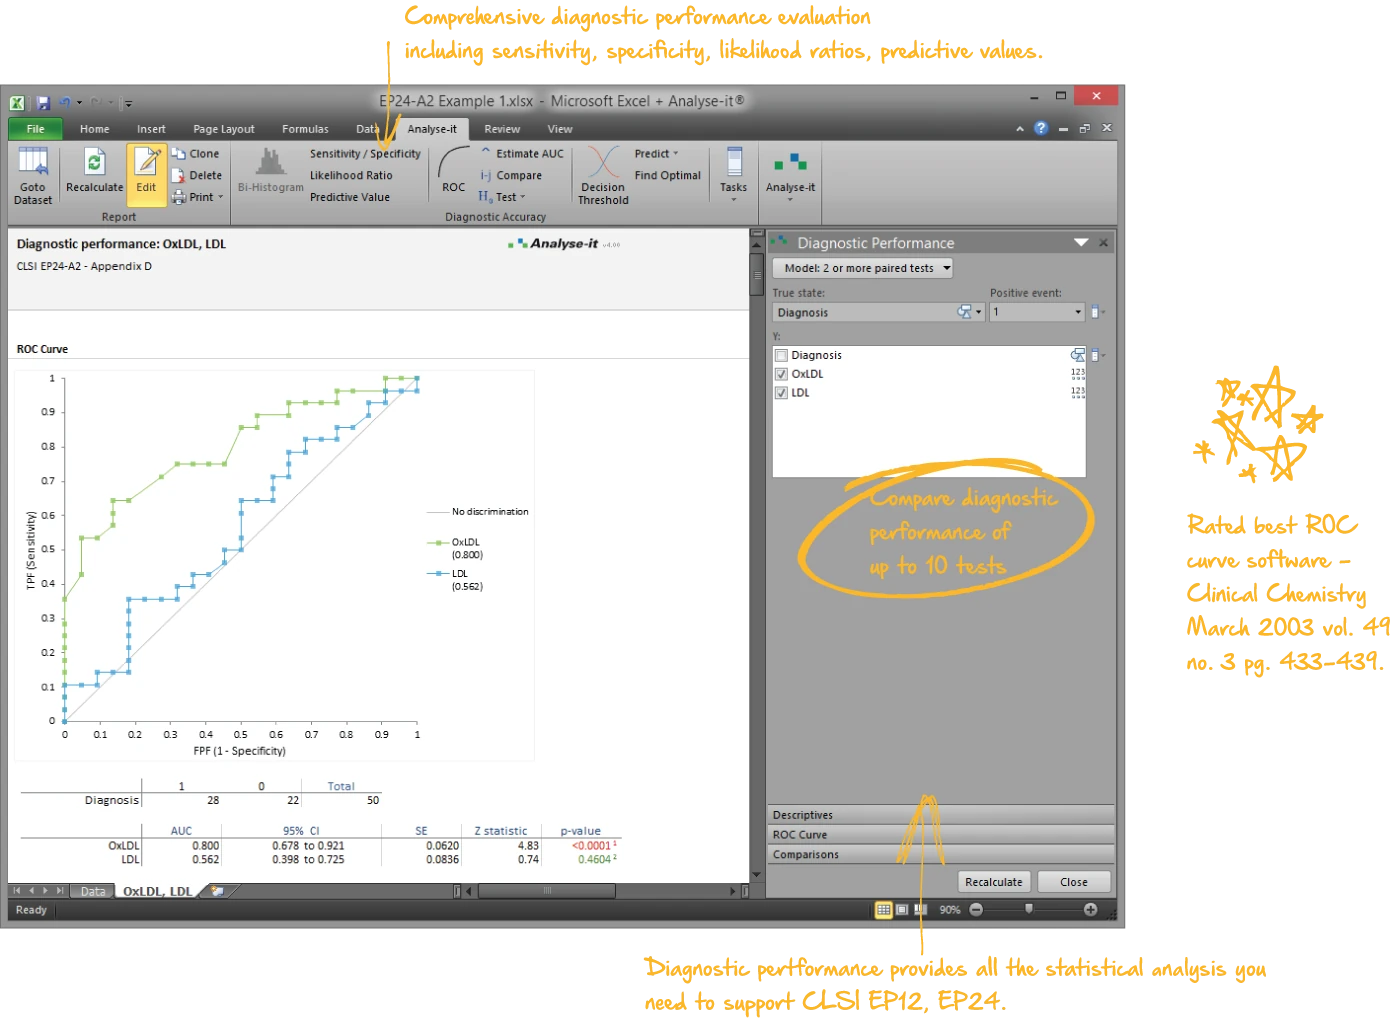
Establish and compare the ability of a diagnostic test to discriminate between outcomes. Explore how the test differentiates between positive and negative cases and determine optimum decision thresholds factoring in clinical costs of misdiagnosis.
All features from the Standard edition are included — ANOVA, PCA, regression, correlation, distribution analysis, hypothesis tests, and more.
So if, or when, a validation study raises questions — an unexpected distribution, a suspect outlier, a relationship that needs further examination — the full general statistics toolkit is right there in the same workbook.
Analyse-it has led the field in method validation statistics software for over 30 years. Many of the procedures now codified in CLSI guidelines — including Passing-Bablok regression, Weighted Deming regression, and non-parametric reference interval methods — were first made widely accessible through Analyse-it, and their adoption into formal guidelines followed.
| EP05-A3 | Evaluation of Precision of Quantitative Measurement Procedures | Precision |
| EP06-A | Evaluation of the Linearity of Quantitative Measurement Procedures | Linearity |
| EP09-A3 | Measurement Procedure Comparison and Bias Estimation Using Patient Samples | Method comparison |
| EP10-A3-AMD | Preliminary Evaluation of Quantitative Clinical Laboratory Measurement Procedures | MSA |
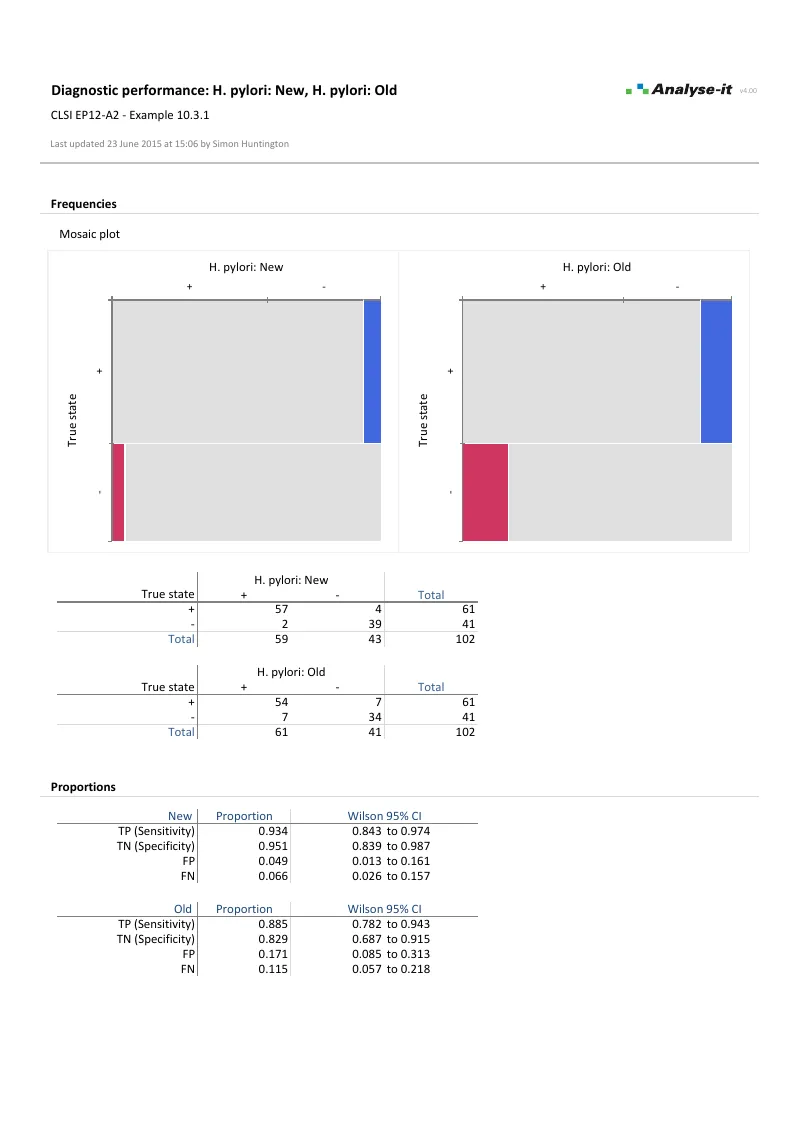
| EP12-A2 | User Protocol for Evaluation of Qualitative Test Performance | Diagnostic performance |
| EP14-A3 | Evaluation of Commutability of Processed Samples | Method comparison |
| EP15-A3 | User Verification of Precision and Estimation of Bias | MSA |
| EP17-A2 | Evaluation of Detection Capability for Clinical Laboratory Measurement Procedures | Detection capability |
| EP21-A | Estimation of Total Analytical Error for Clinical Laboratory Methods | Method comparison |
| EP24-A2 | Assessment of the Diagnostic Accuracy of Laboratory Tests Using Receiver Operating Characteristic Curves | Diagnostic performance |
| EP28-A3C | Defining, Establishing, and Verifying Reference Intervals in the Clinical Laboratory | Reference intervals |
Download CLSI example datasets, open them in the trial, and see exactly what the output looks like.
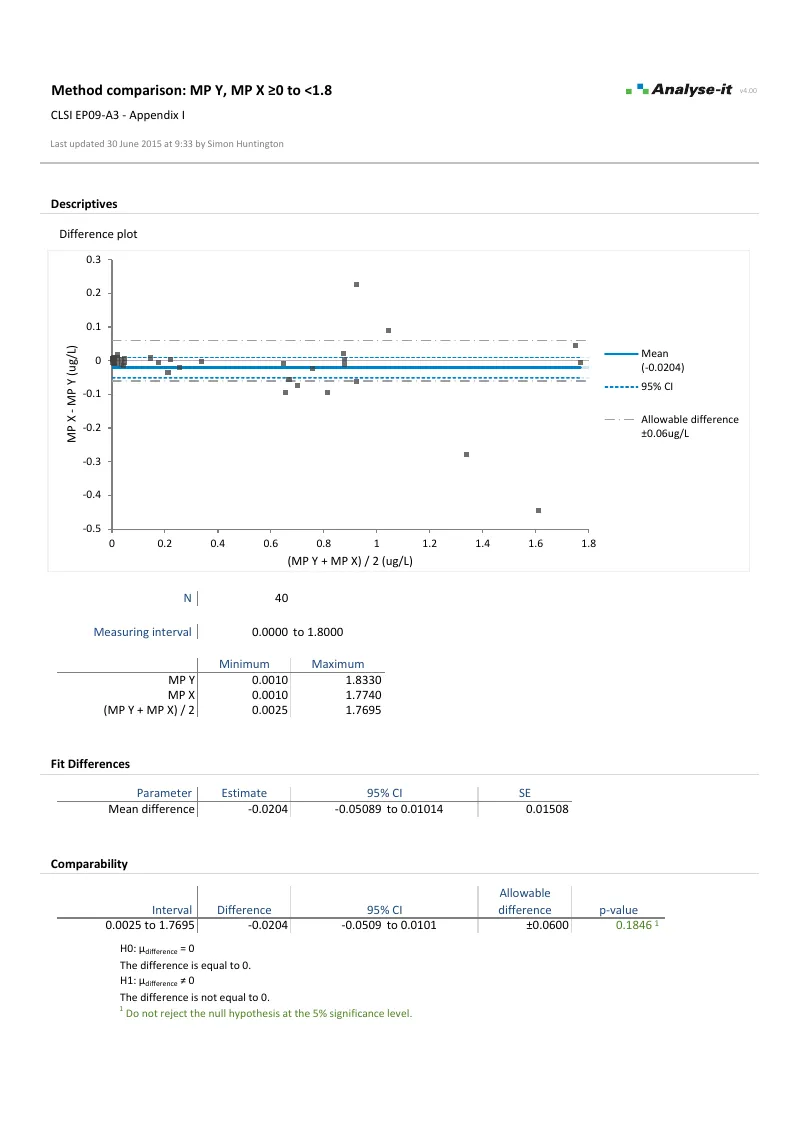 EP09-A3 — Appendix I
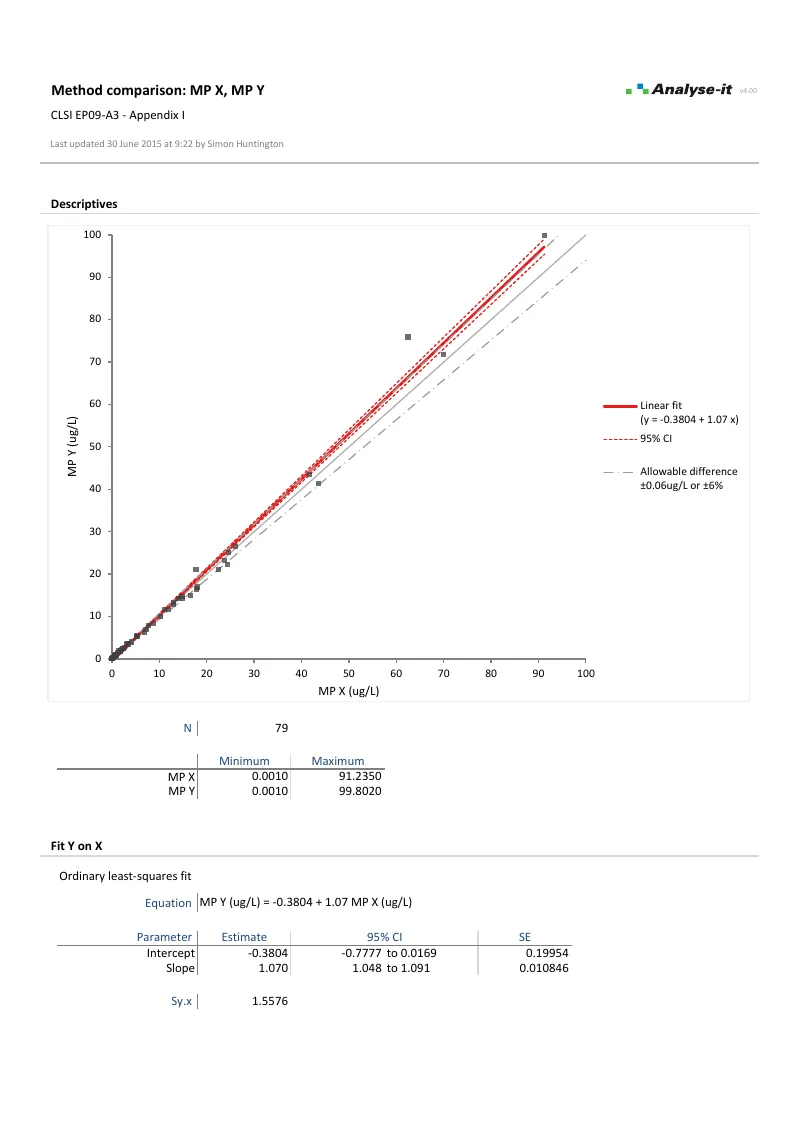 EP09-A3 — Appendix I
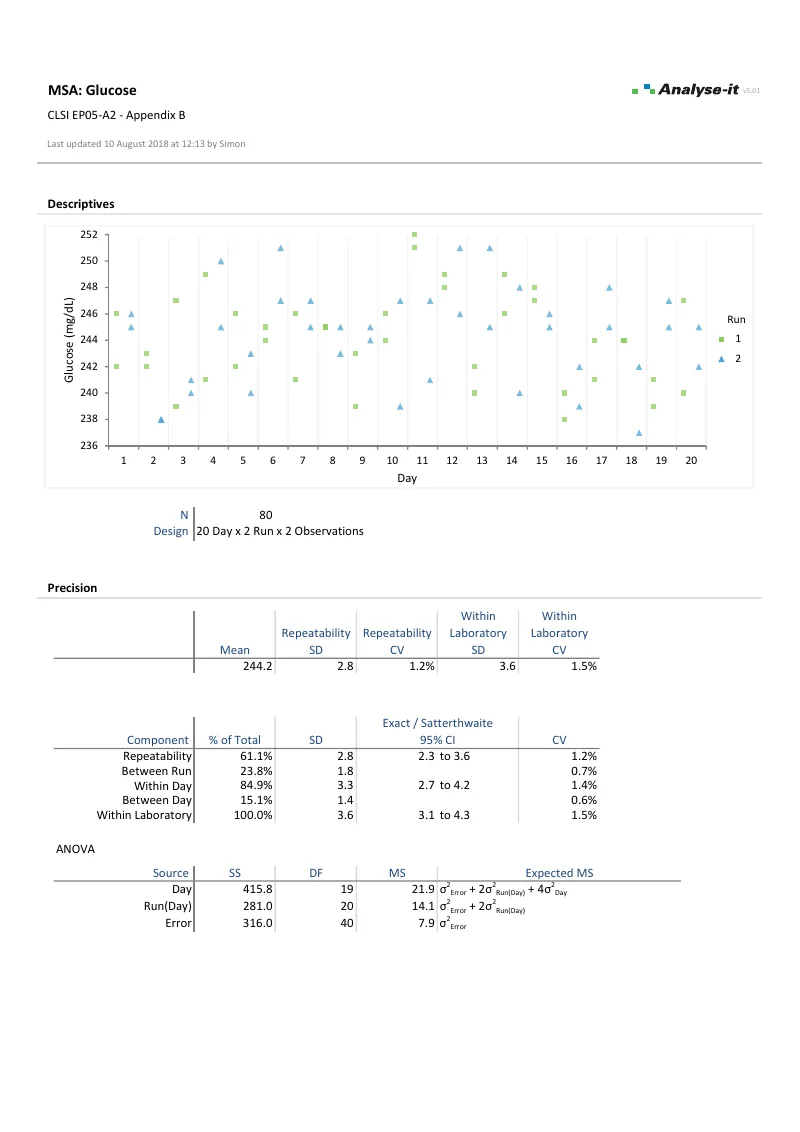 EP05-A3 — Appendix B
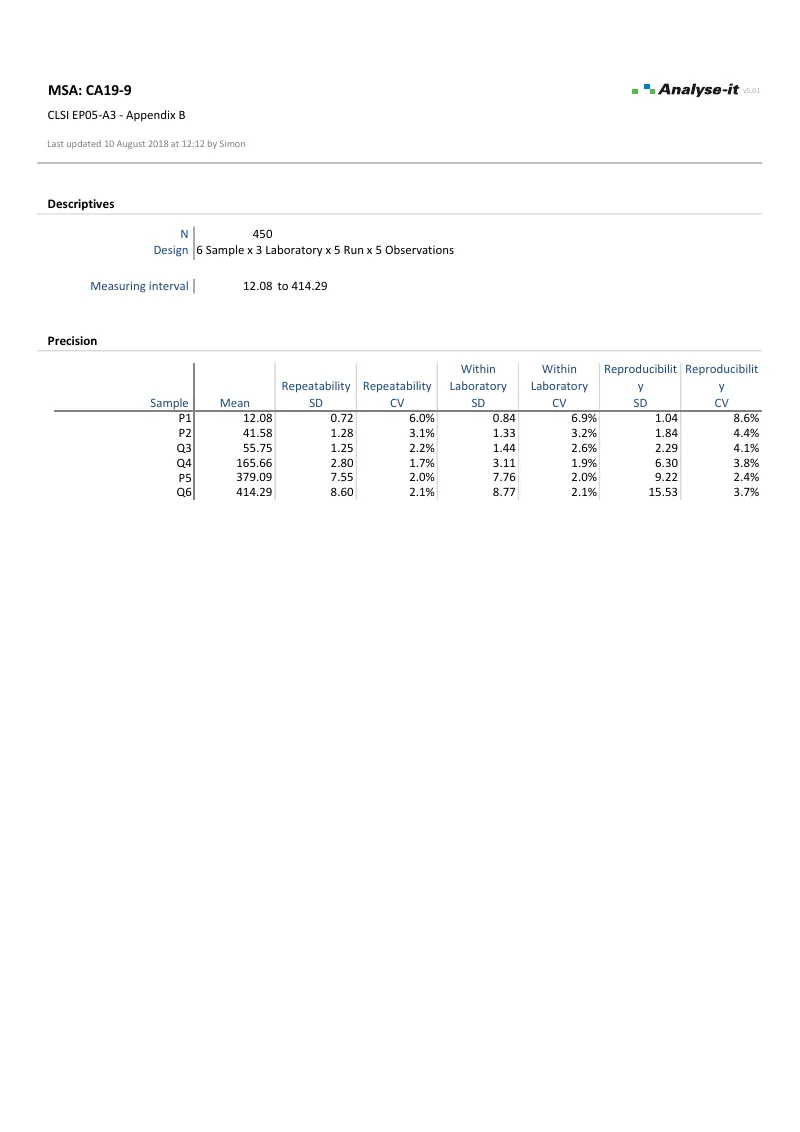 EP05-A3 — Appendix B
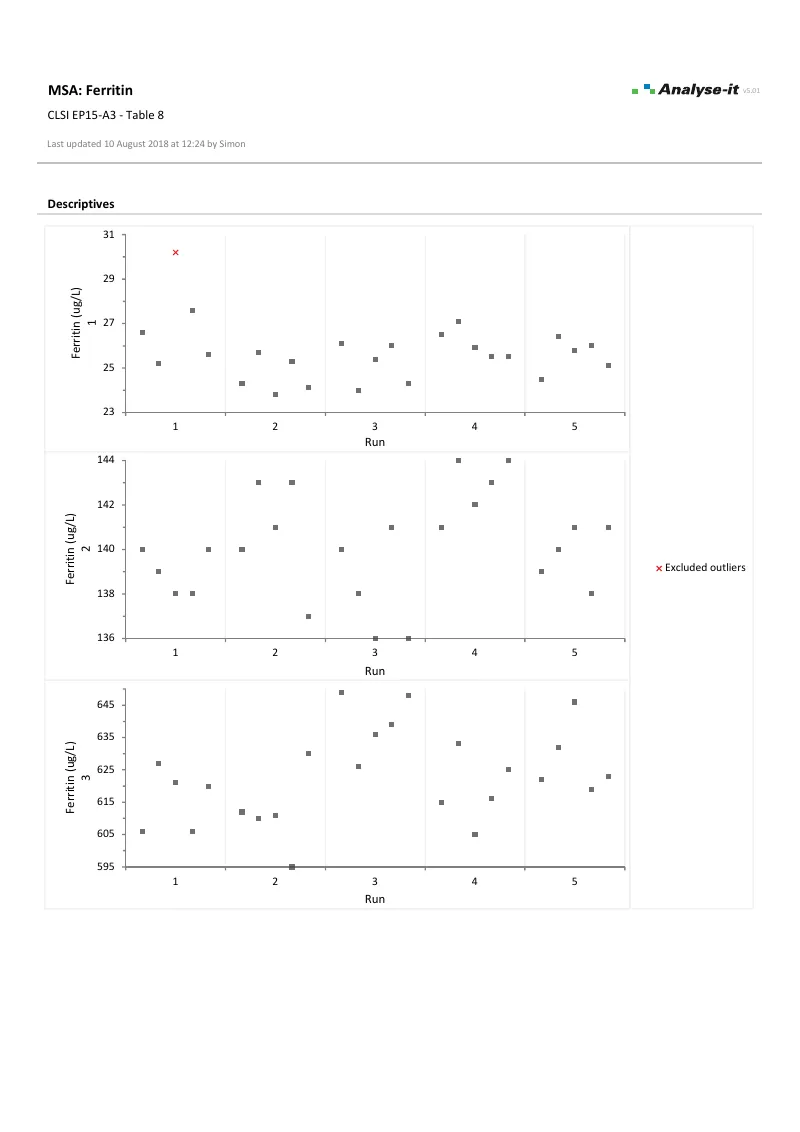 EP15-A3 — Table 8
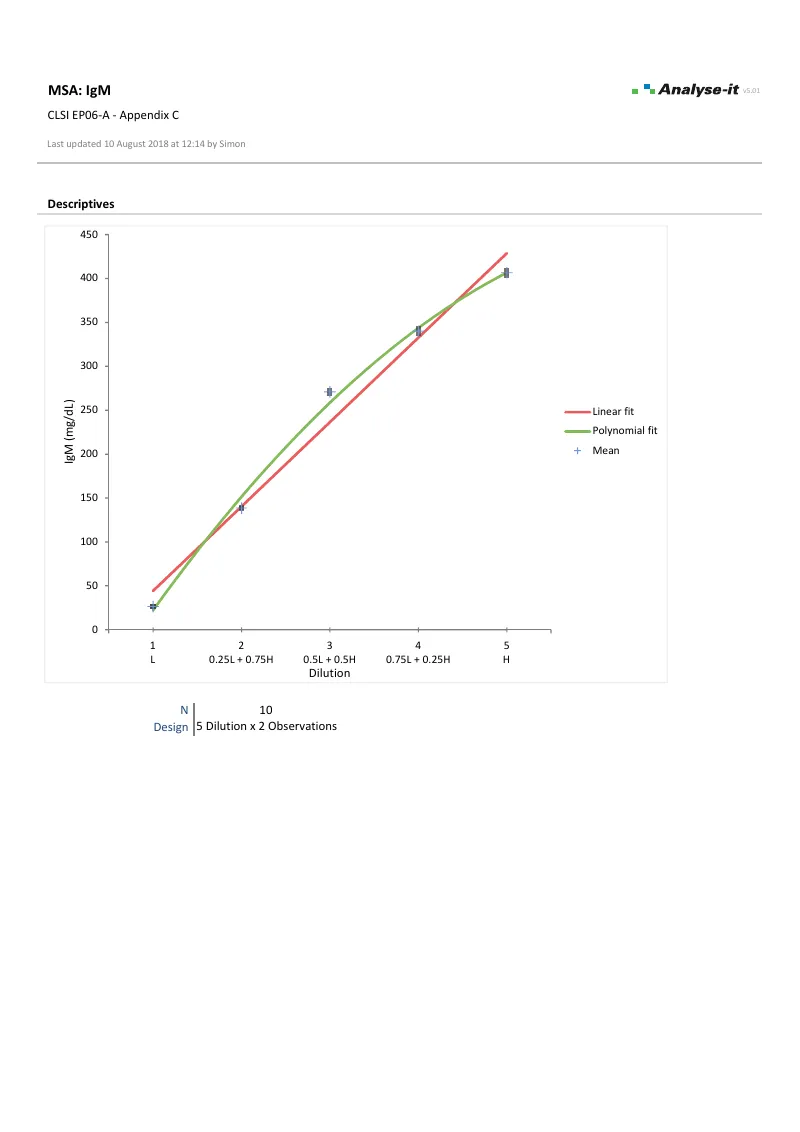 EP06-A — Appendix C
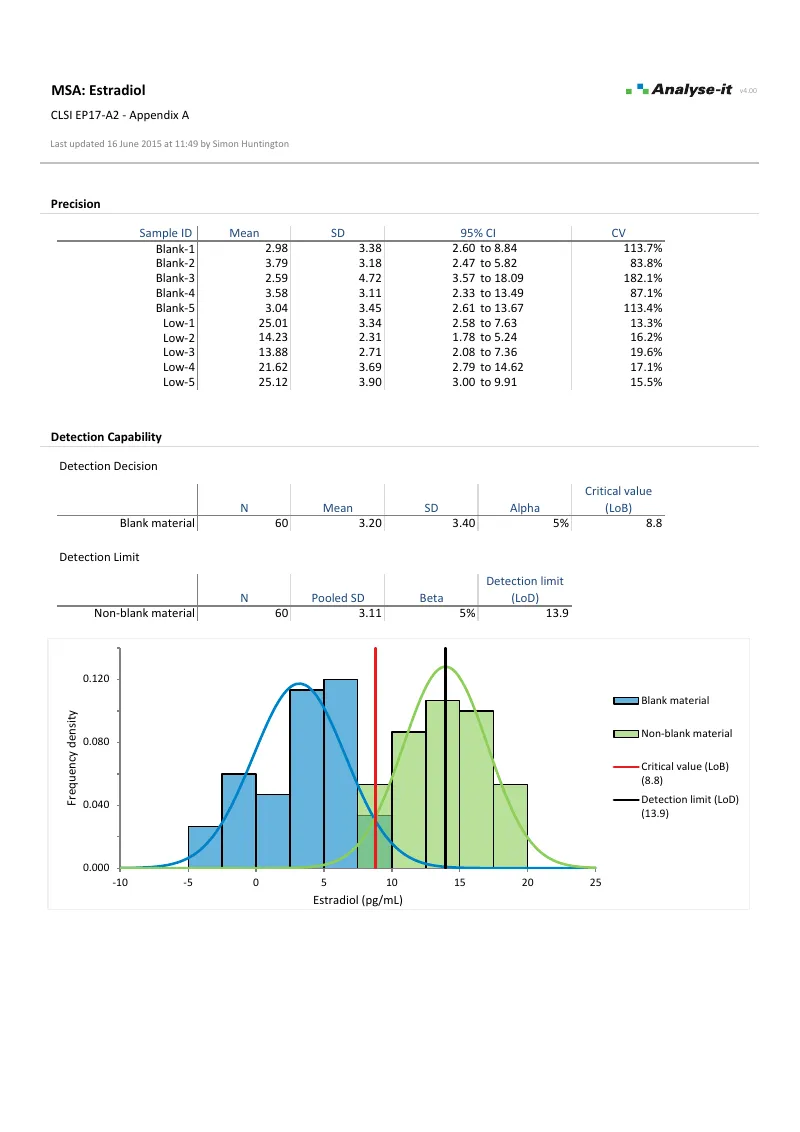 EP17-A2 — Appendix A
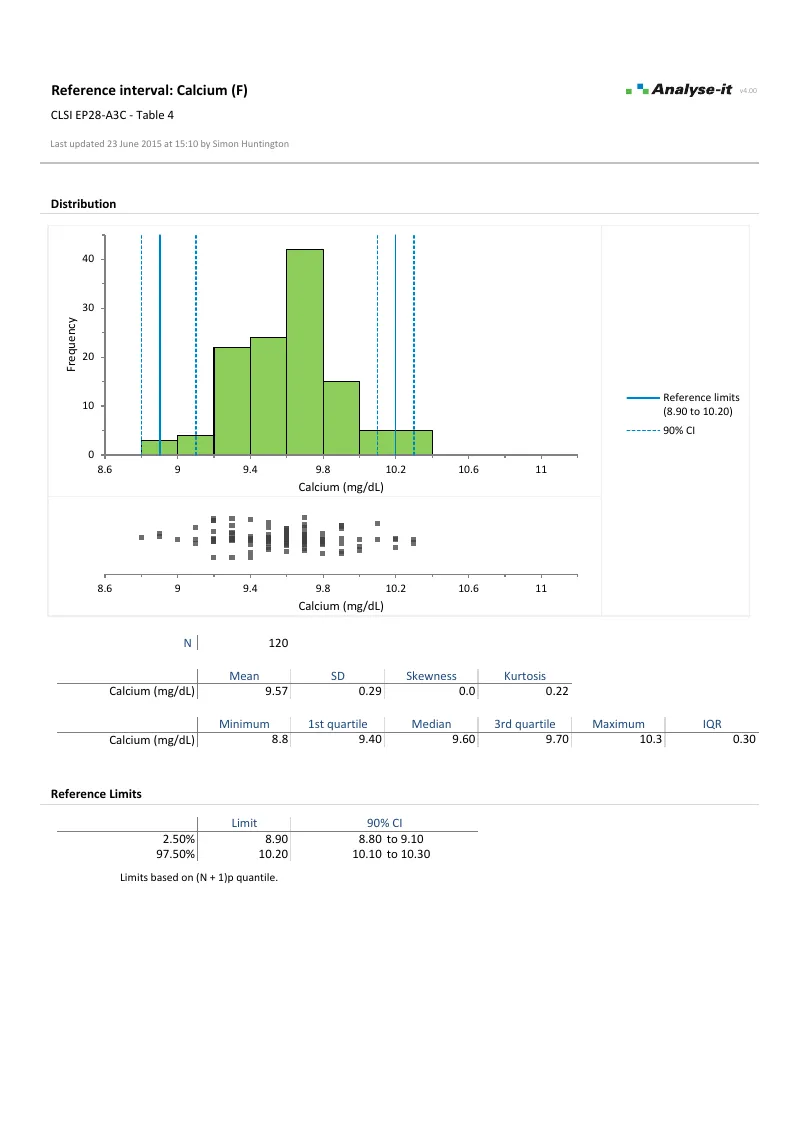 EP28-A3C — Table 4