Analyse-it
Analyse-it
  • Products
  • Pricing
  • Support
  • About us
Download trial Sign in
  • Statistical Reference Guide
  • Compare groups

Mean-Mean scatter plot

A mean-mean scatter plot shows a 2-dimensional representation of the differences between many means.


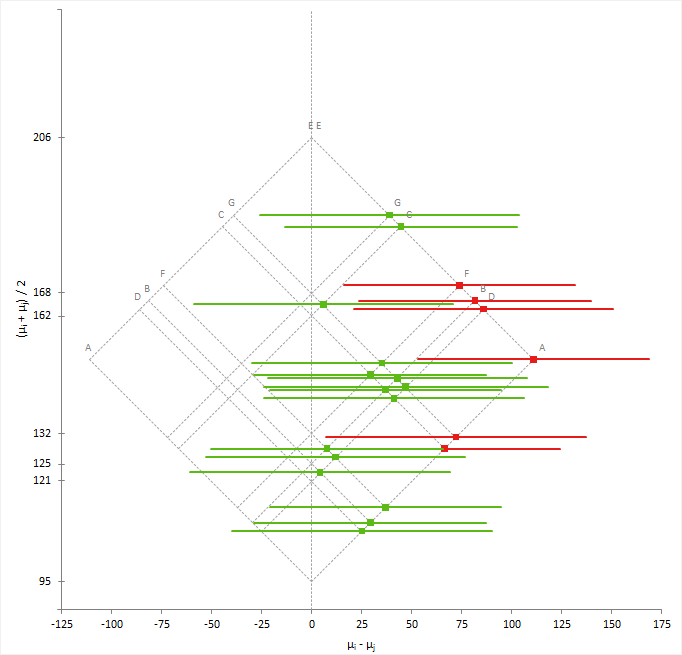
The mean-mean scatter plot shows the mean of a group on the horizontal axis against the mean of the other group on the vertical axis with a dot at the intersection. A vector centered at the intersection with a slope of -1 and a length proportional to the width of the confidence interval represents the confidence interval. A gray identity line represents equality of means; that is the difference is equal to zero. If the vector does not cross the identity line, you can conclude there is a significant difference between the means.

To make interpretation easier, a 45-degree rotated version of the plot shows the difference between means and its confidence interval on the horizontal axis against average of the means on the vertical axis.

Related concepts
Multiple comparisons
Related tasks
Comparing multiple means/medians
Available in Analyse-it Editions
Standard edition
Method Validation edition
Quality Control & Improvement edition
Ultimate edition

  •  What is Analyse-it?
  •  What's new?
  •  Administrator's Guide
  •  User's Guide
  •  Statistical Reference Guide
  •  Distribution
  •  Compare groups
  •  Calculating univariate descriptive statistics, by group
  •  Side-by-side univariate plots
  •  Creating side-by-side univariate plots
  •  Equality of means/medians hypothesis test
  •  Equivalence of means hypothesis test
  •  Tests for means/medians
  •  Testing equality of means/medians
  •  Testing equivalence of means
  •  Difference between means/medians effect size
  •  Estimators for the difference in means/medians
  •  Estimating the difference between means/medians
  •  Multiple comparisons
  •  Mean-Mean scatter plot
  •  Multiple comparison procedures
  •  Comparing multiple means/medians
  •  Homogeneity of variance hypothesis test
  •  Tests for homogeneity of variance
  •  Testing homogeneity of variance
  •  Study design
  •  Compare pairs
  •  Contingency tables
  •  Correlation and association
  •  Principal component analysis (PCA)
  •  Factor analysis (FA)
  •  Item reliability
  •  Fit model
  •  Method comparison / Agreement
  •  Measurement systems analysis (MSA)
  •  Reference interval
  •  Diagnostic performance
  •  Survival/Reliability
  •  Control charts
  •  Process capability
  •  Pareto analysis
  •  Study Designs
  •  Bibliography


Version 6.15
Published 18-Apr-2023
Products
  • Standard Edition
  • Medical Edition
  • Quality Control & Improvement Edition
  • Method Validation Edition
  • Ultimate Edition
  • Compare Editions
  • Pricing
Support
  • Documentation
  • Tutorials
  • Download latest version
  • Release history
  • Contact support
Company
  • About us
  • Blog
  • Contact us
  • Privacy policy

Get Started

  • Download free trial
  • Sign In

© 2026 Analyse-it® Software, Ltd. All rights reserved.

Statistical analysis and method validation software for Microsoft Excel.

We use essential cookies to run the site, and optional analytics to improve the experience for visitors. For more information see our Privacy policy.