DMAIC improvement work demands a complete statistical toolkit — control charts to measure stability, capability indices to quantify performance, Pareto and hypothesis tests to analyze root causes, regression to model relationships during improve, and ongoing SPC to control the gains. Most teams end up with one tool for charts, another for capability, and a third for the hypothesis tests and regression that the analyse and improve phases require.
The Quality Control & Improvement edition brings the full DMAIC toolkit together in one package inside Excel. Shewhart, CUSUM, and EWMA control charts with proper detection rules. Capability indices with confidence intervals and non-normal data handling. Pareto charts for prioritisation. The complete general statistics toolkit — hypothesis tests, ANOVA, regression — for the investigation phases. No data leaves your PC. Results stay in standard Excel workbooks that you can share with colleagues, send to auditors, and archive for quality records.
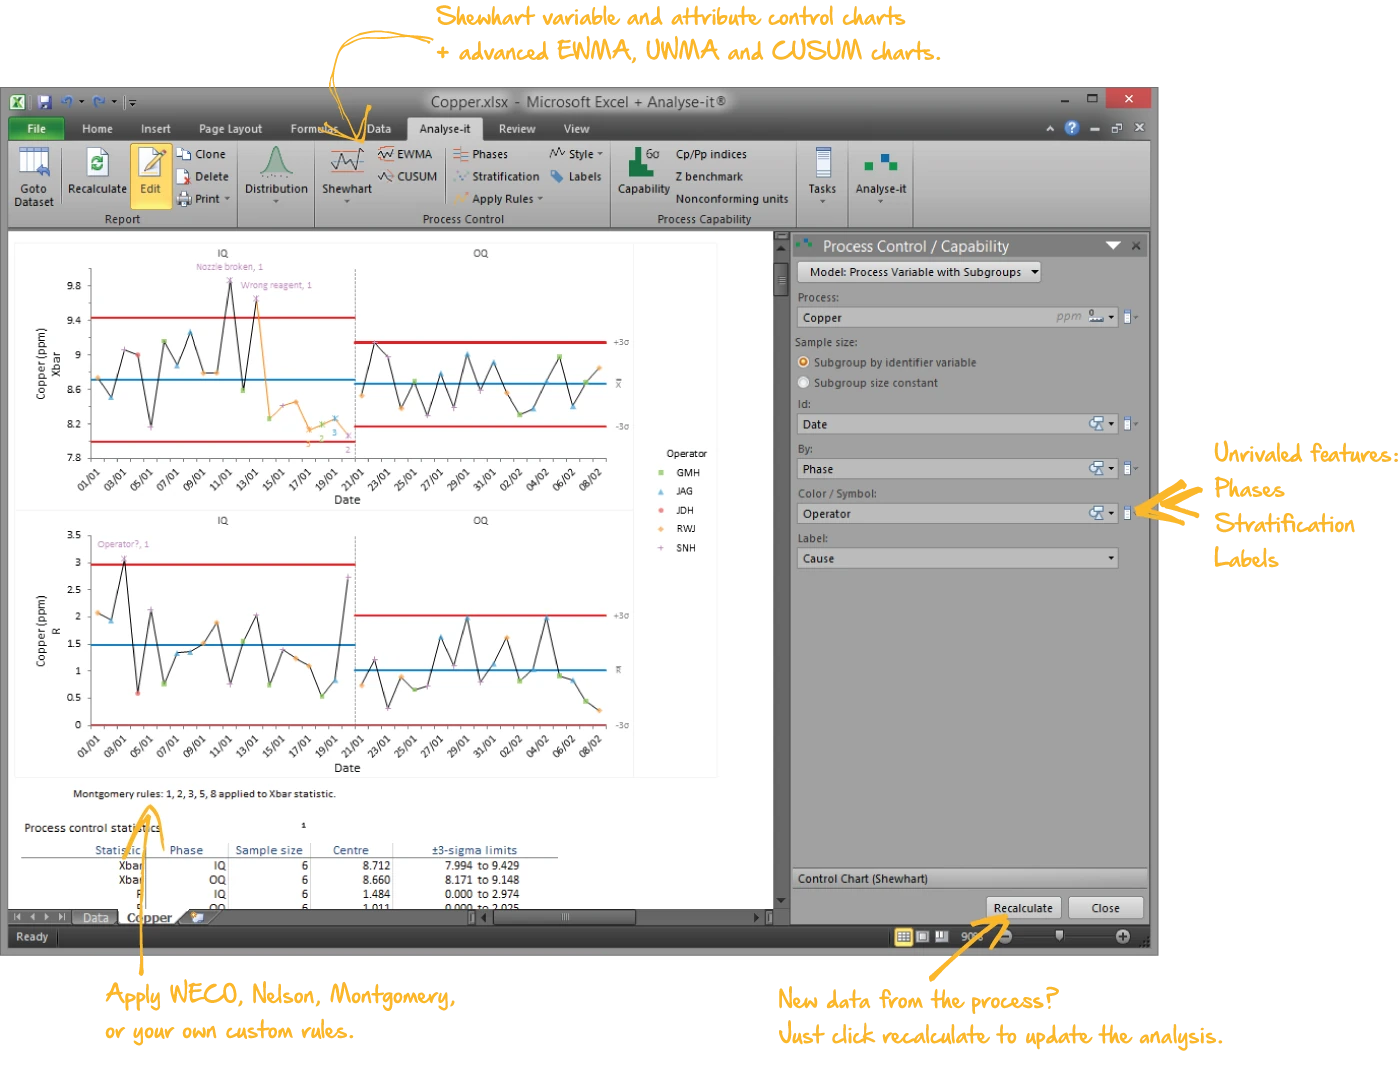
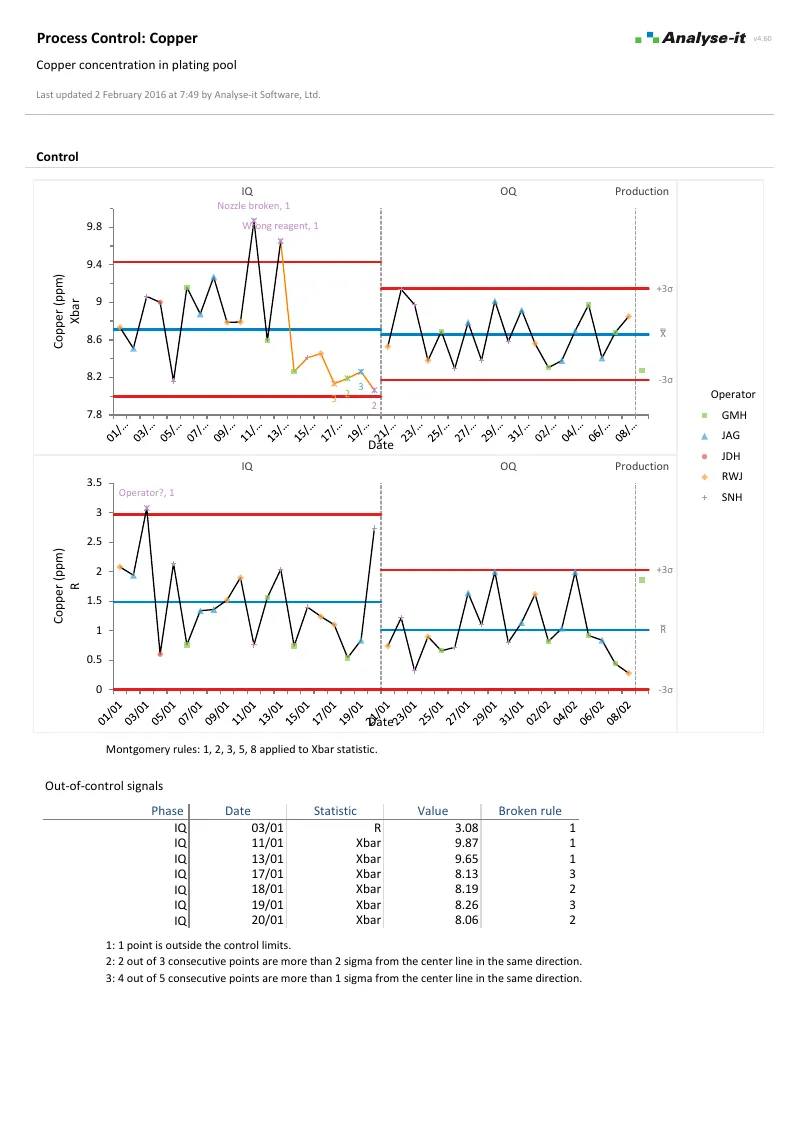
Shewhart variable and attribute charts with automatic detection rules, plus time-weighted charts for detecting small, sustained shifts that Shewhart charts miss:
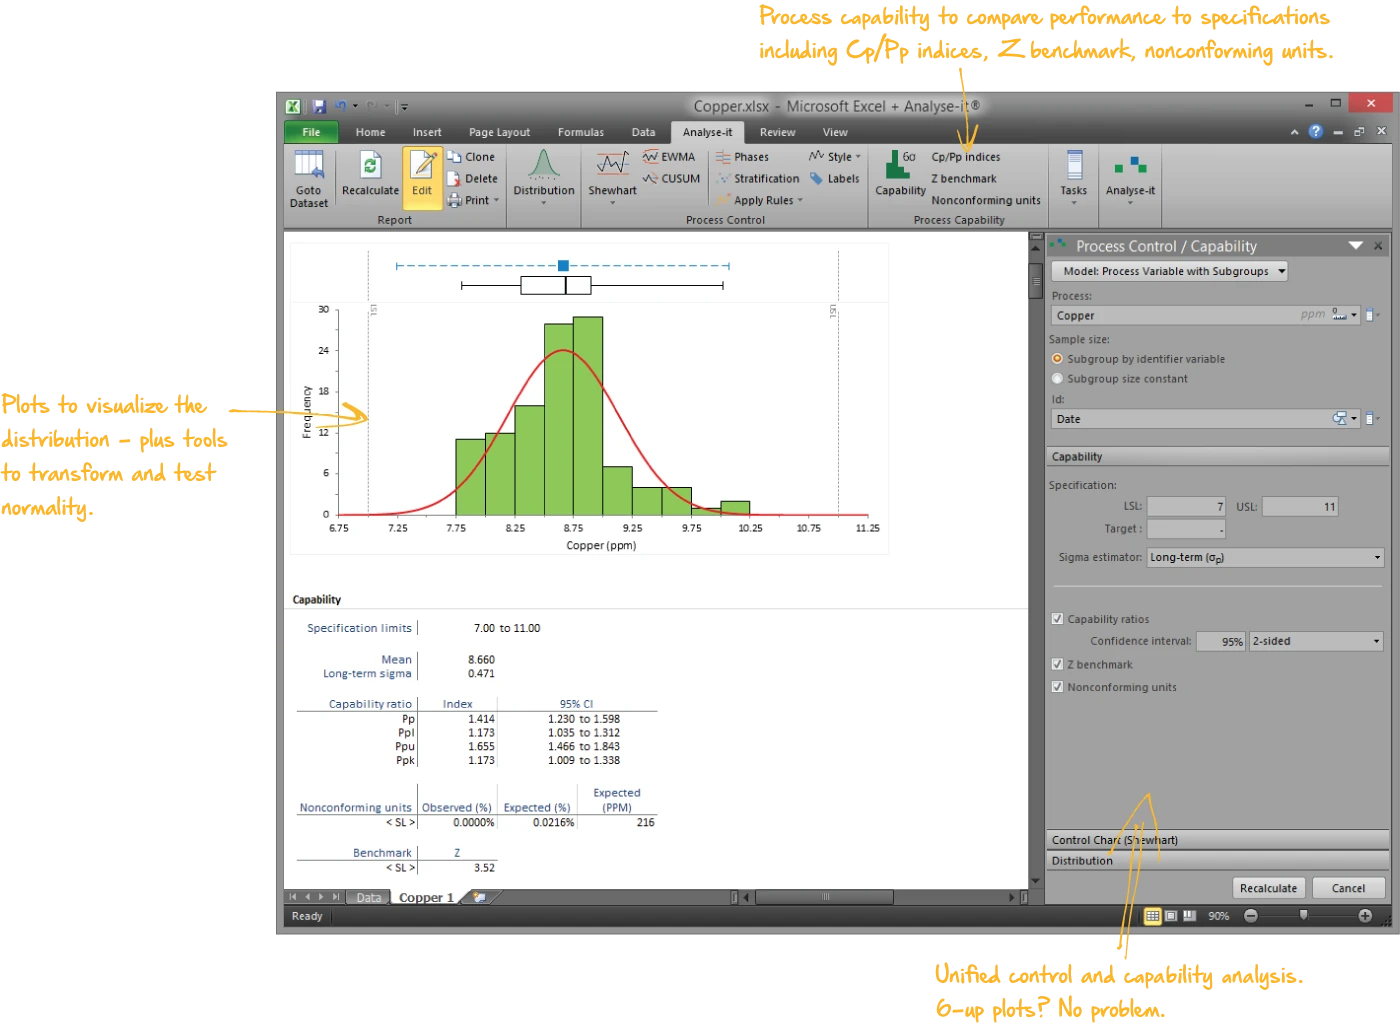
Capability and performance indices with confidence intervals, non-normal data handling, and the control charts to confirm stability first:
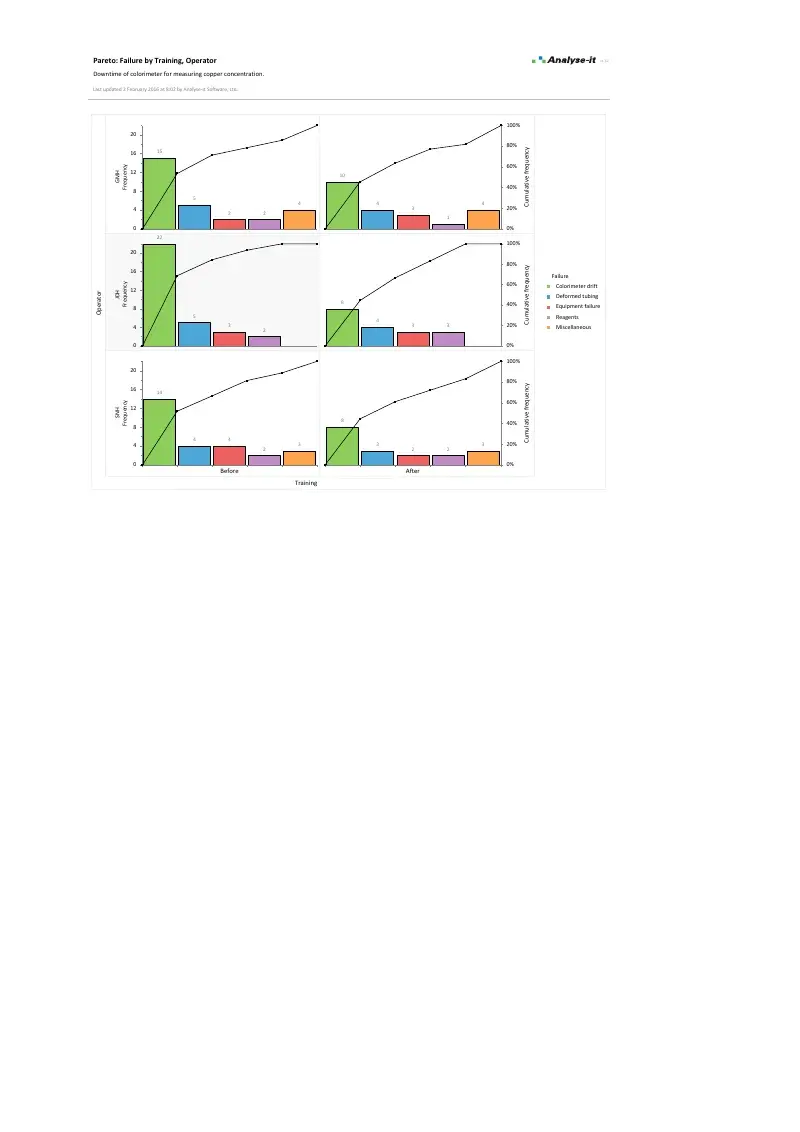
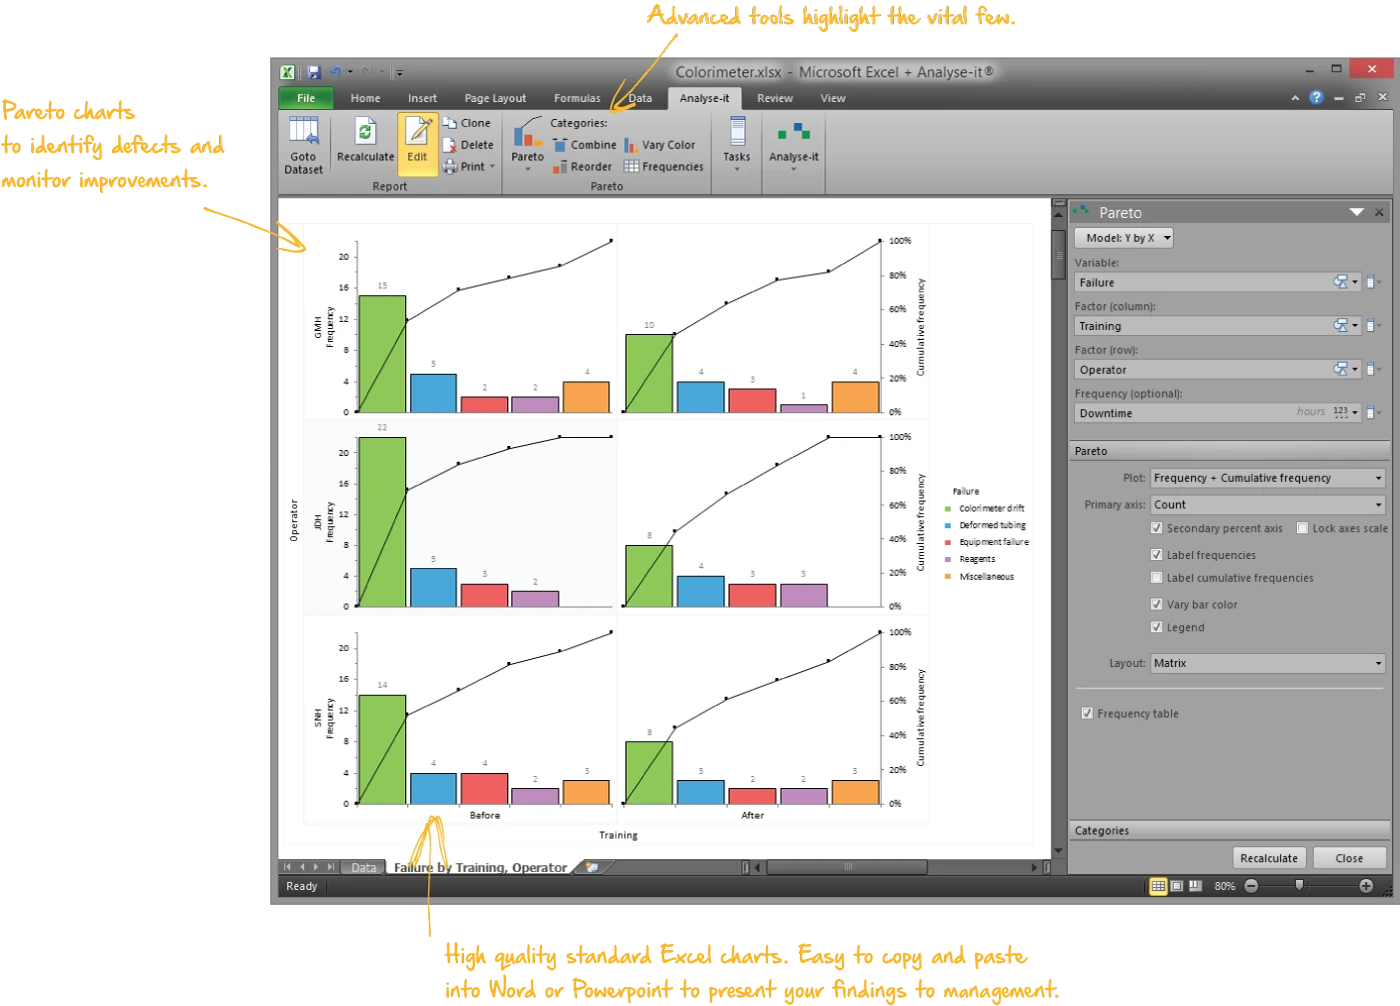
Pareto charts to identify the most frequently occurring defects and break them down by contributing factors:
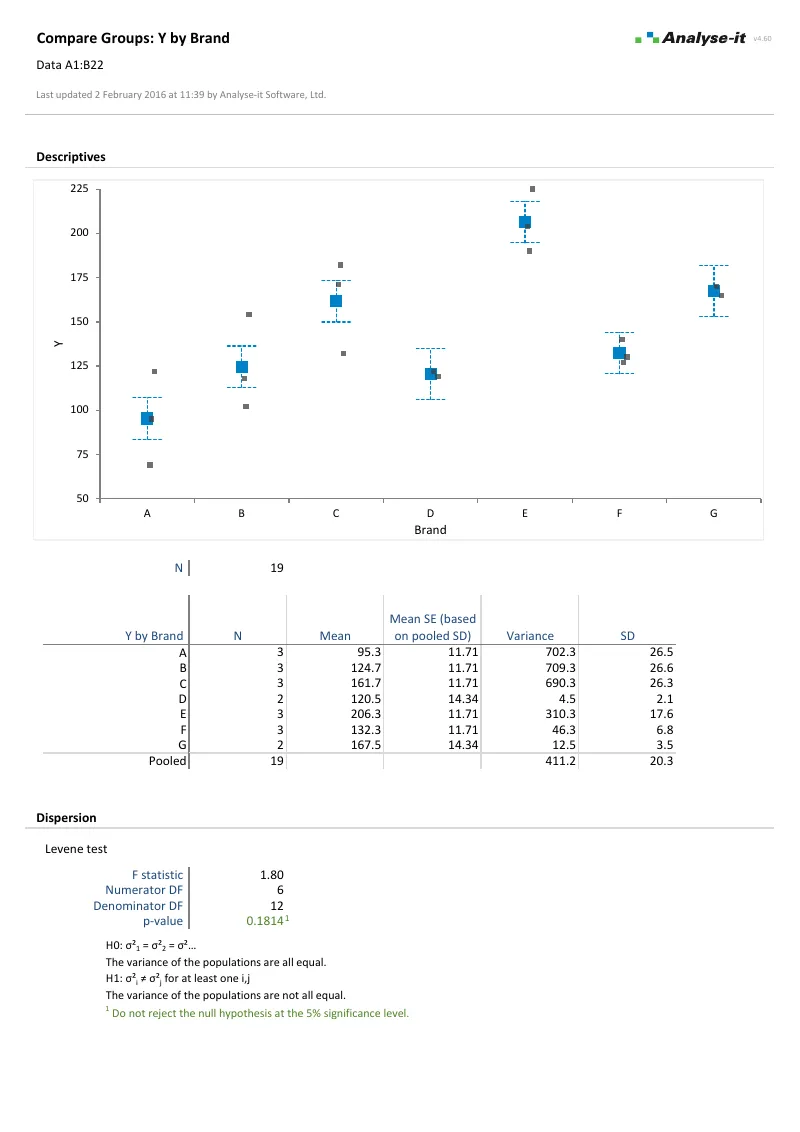
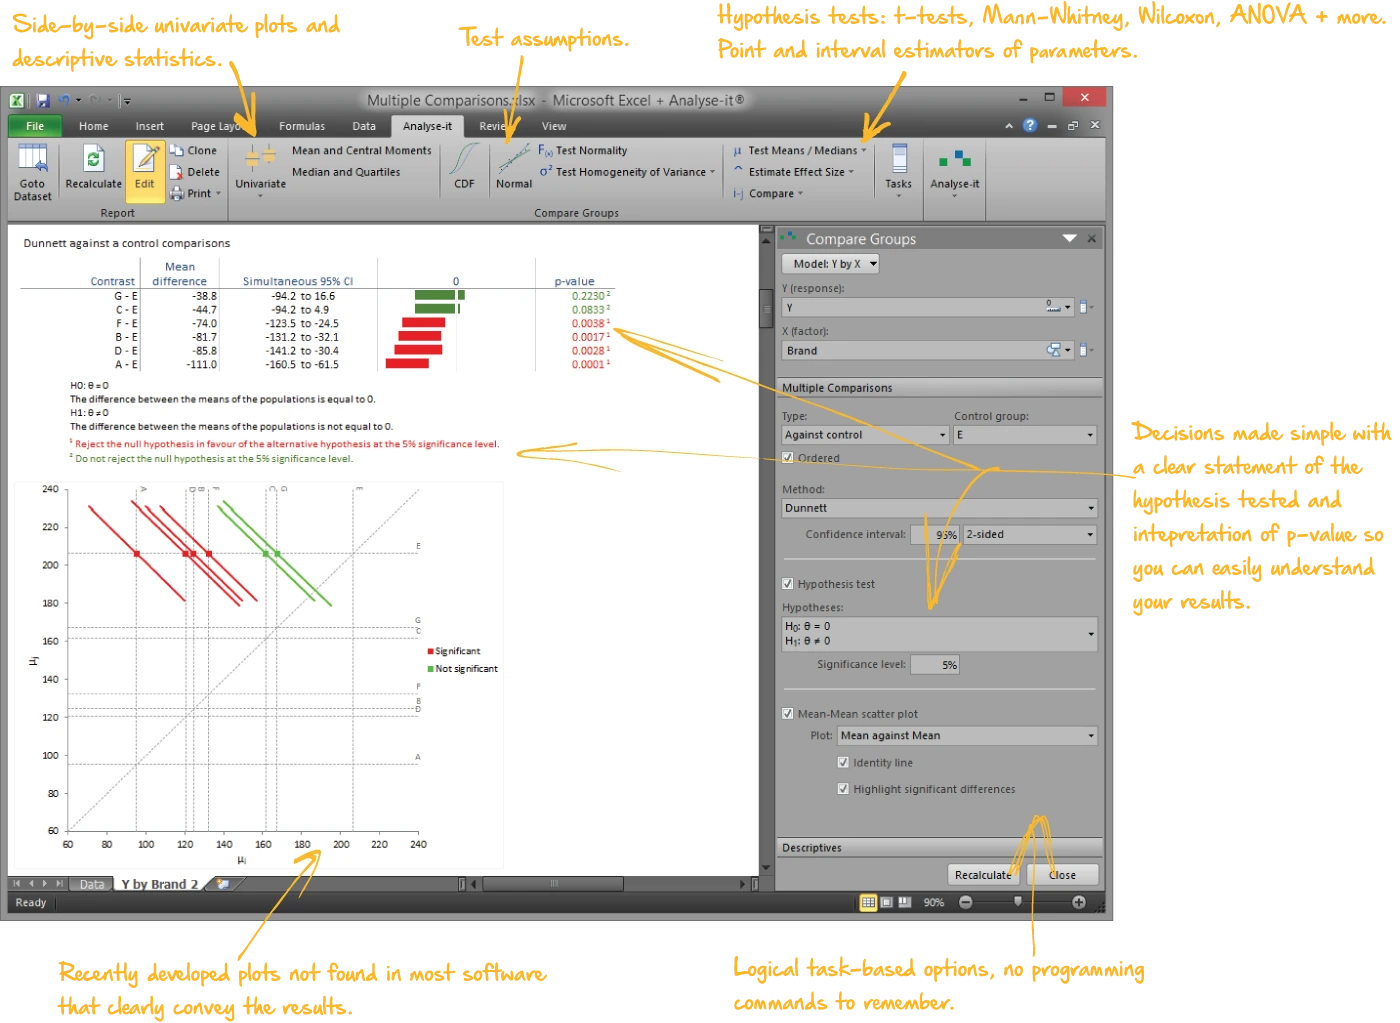
When the control chart flags a problem and the Pareto points to a suspect, hypothesis tests and ANOVA confirm whether the difference is real:
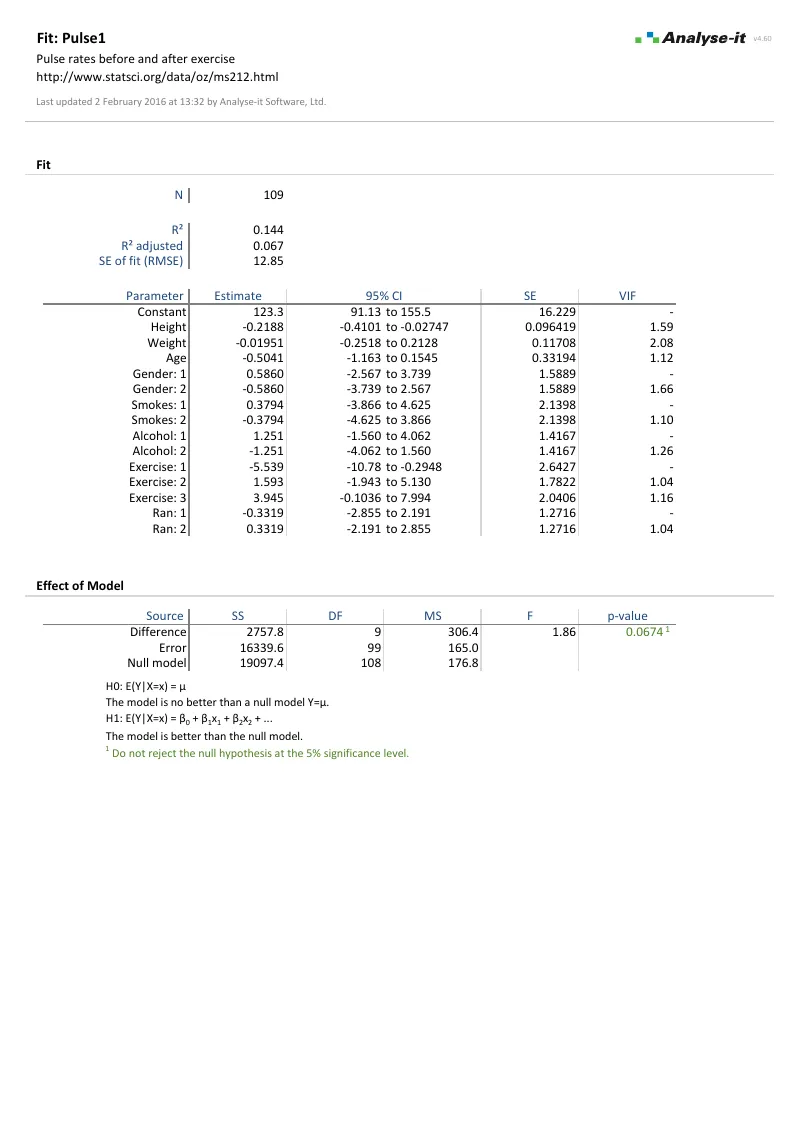
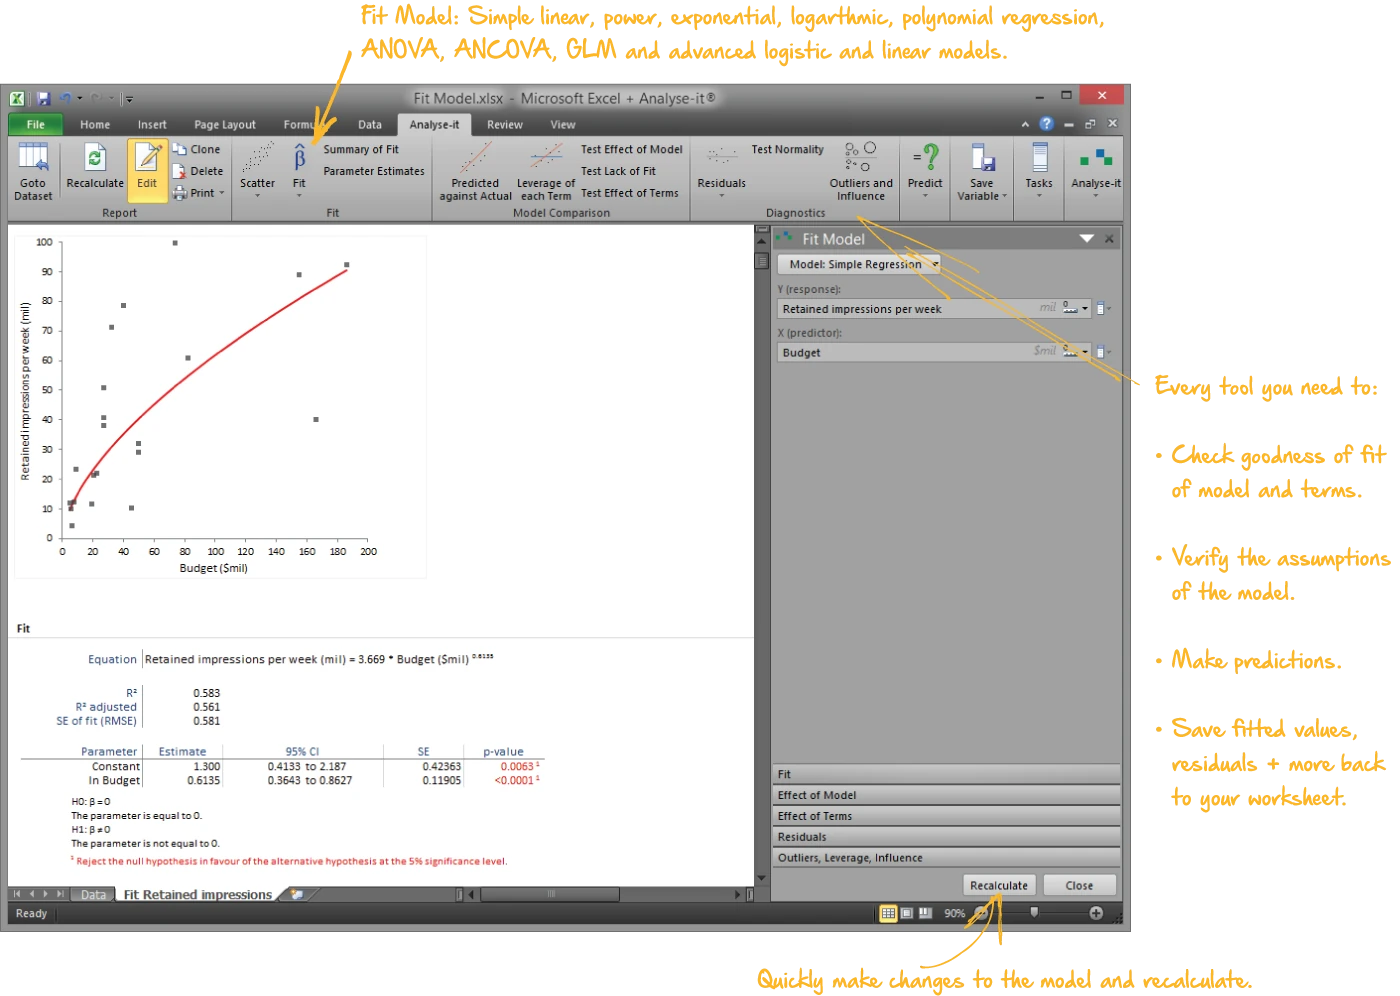
Regression to model the relationship between process inputs and outputs, and ANOVA to quantify the effect of changes:
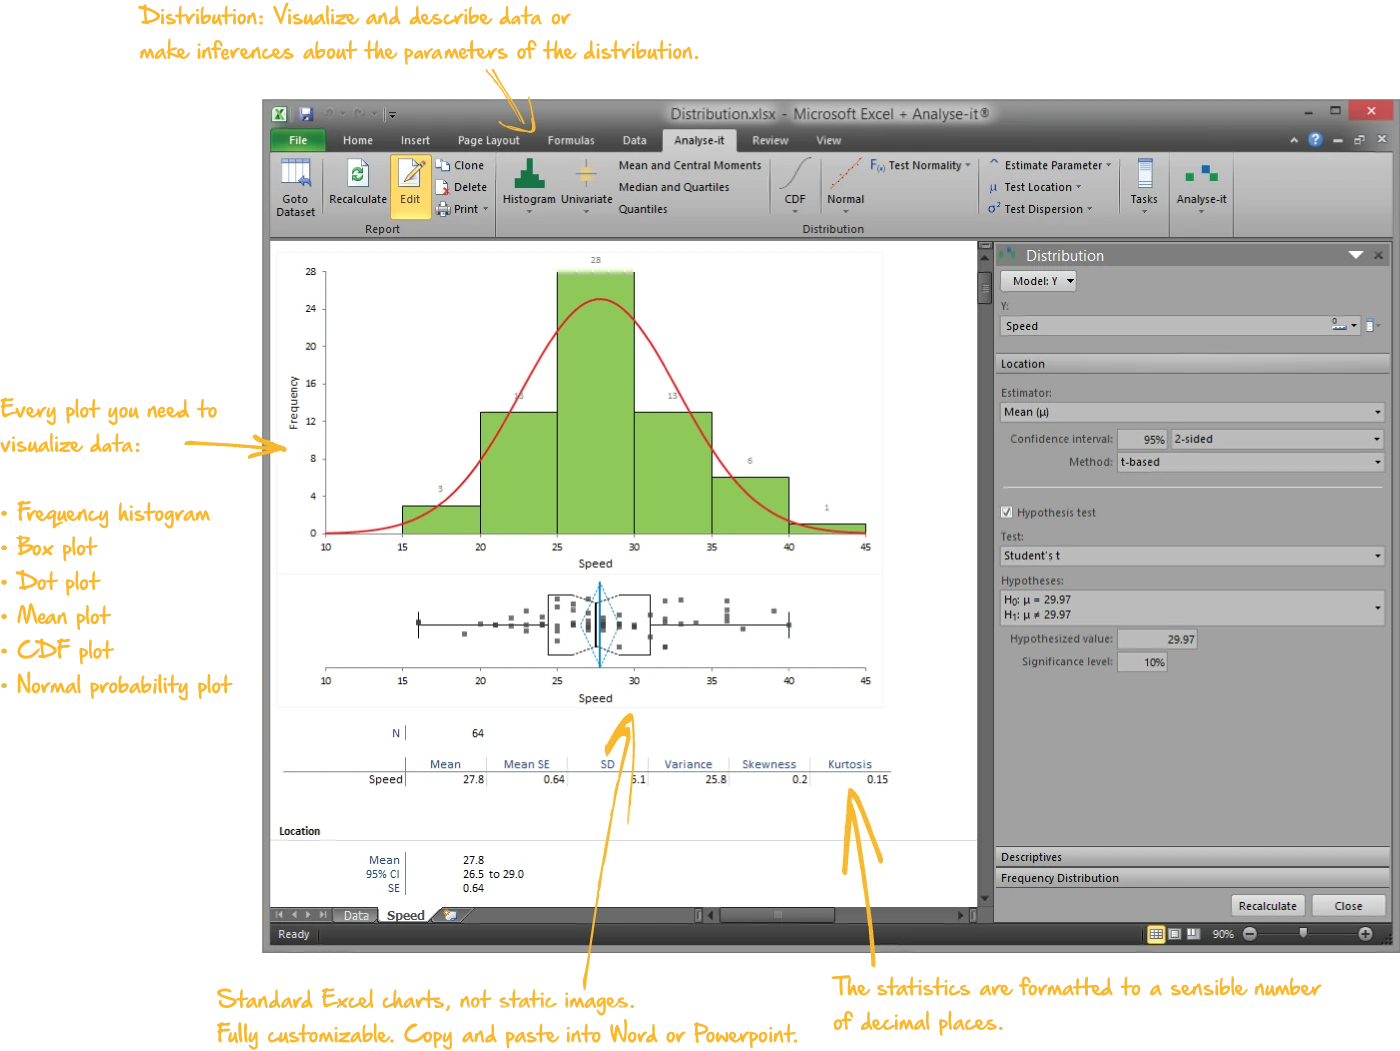
Before investigating root causes, understand the distribution:
The Quality Control & Improvement edition includes every feature from the Standard edition — the general-purpose statistics toolkit that quality teams use for the investigation and improvement stages of the workflow. Hypothesis tests, ANOVA, regression, descriptive statistics, correlation, contingency tables, PCA, and logistic regression are all in the same workbook as your control charts and capability analyses.
Download example datasets, open them in the trial, and see exactly what the output looks like.
 Control charts — Xbar-R
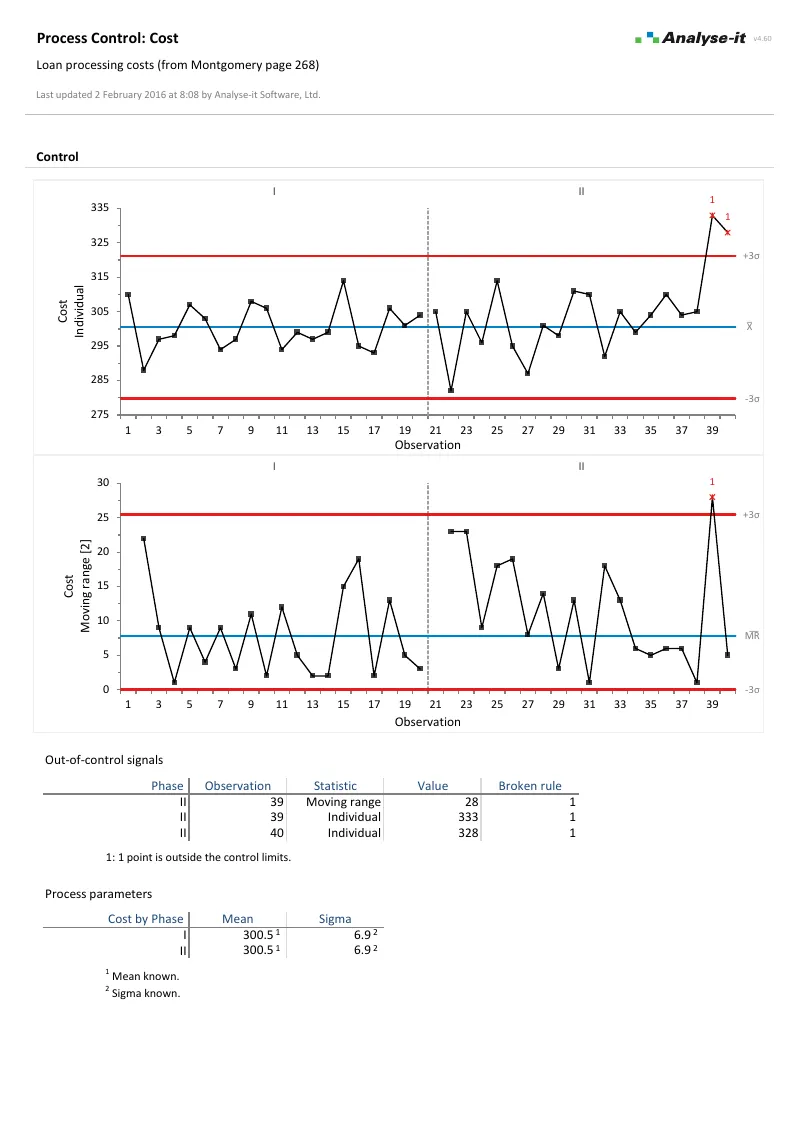 I-MR and attribute charts
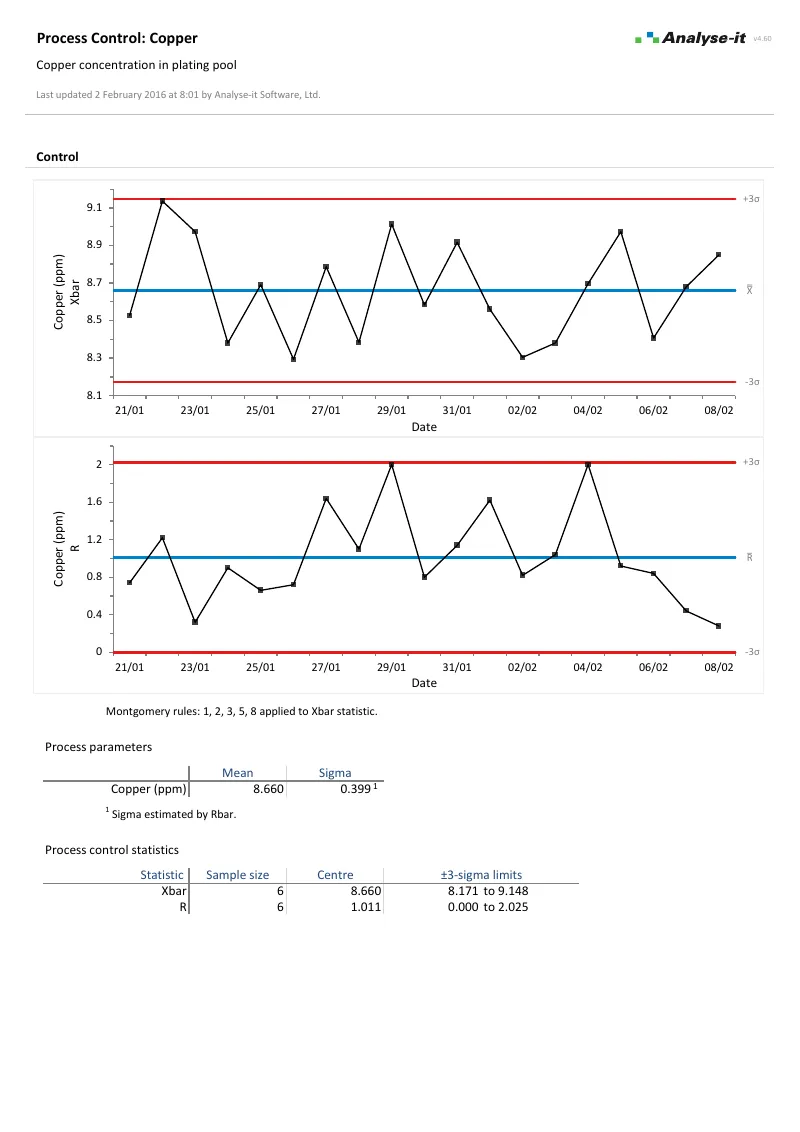 Process capability
The Quality Control & Improvement edition includes every feature from the Standard edition. See the Standard edition page for the full technical specification, including: