
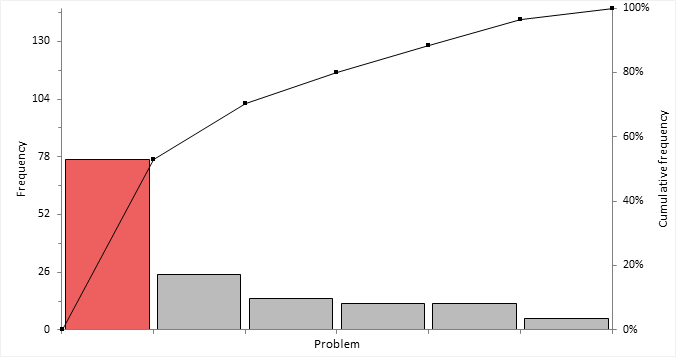
Pareto chart
A Pareto chart shows the frequency of occurrences of quality-related problems to highlight those that need the most attention.
Note: In user-interface controls and documentation, it is typical to refer to the count/frequency for usability and clarity rather than more generic terms such as measure/unit of measurement.