Statistical process control software for quality improvement Shewhart variable and attribute charts, CUSUM, EWMA, process capability indices, and Pareto analysis — the complete SPC toolkit for the Measure, Analyse, Improve, and Control phases of your improvement projects.
Trusted by 75,000 researchers, analysts, and scientists at leading universities, hospitals, and companies worldwide � for over 30 years.
Every control chart type in one package
Shewhart variable charts (Xbar-R, Xbar-S, I-MR), attribute charts (p, np, c, u), and time-weighted charts (CUSUM, EWMA, UWMA). WECO, Nelson, and Montgomery detection rules. Phases for before-and-after comparison, stratification by operator, shift, or machine.
Capability indices with proper assumptions
Cp, Cpk, Pp, Ppk, Cpm, Z-benchmark, and sigma level � all with confidence intervals. Box-Cox and other transformations for non-normal data, because capability indices on non-normal distributions produce meaningless numbers.
Results the whole team can share
All charts and results stay in Excel workbooks. Anyone on the team can open them, anyone in management can receive a report, and sharing with auditors or customers means sending a file � not buying another licence.
Most SPC tools handle one part of the improvement workflow well and leave the rest to other tools. Dedicated control chart packages cover the Control phase but not the hypothesis tests and regression that the Analyse and Improve phases require. General-purpose statistics packages cover the analysis but treat SPC as an afterthought � bolted-on control charts without proper detection rules, phasing, or stratification. The result is that improvement teams end up stitching together multiple tools, transferring data between them, and losing continuity across the DMAIC cycle.
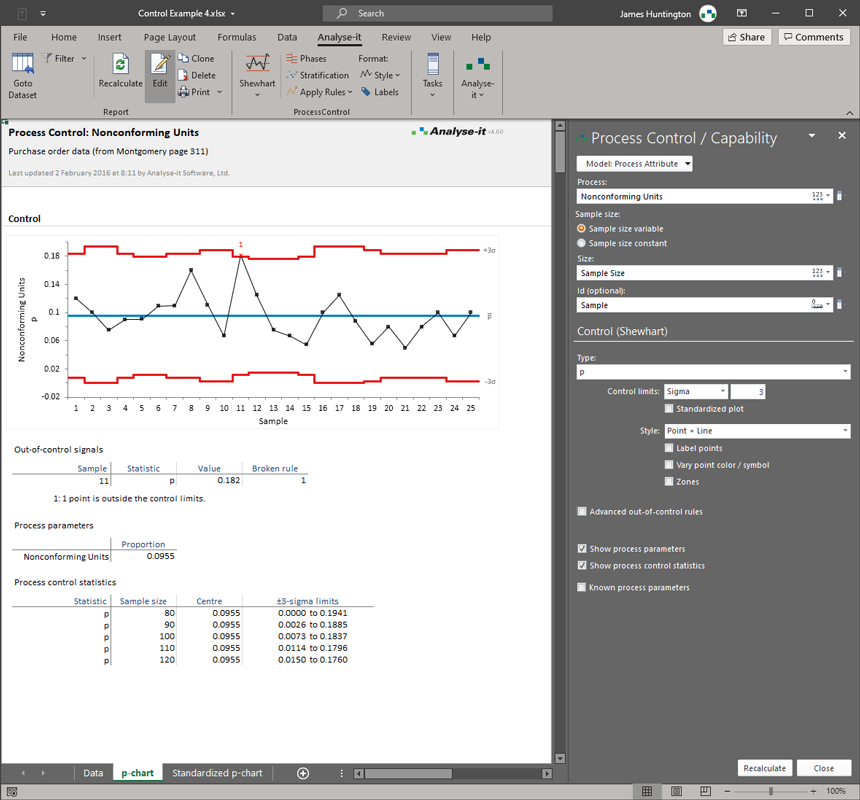
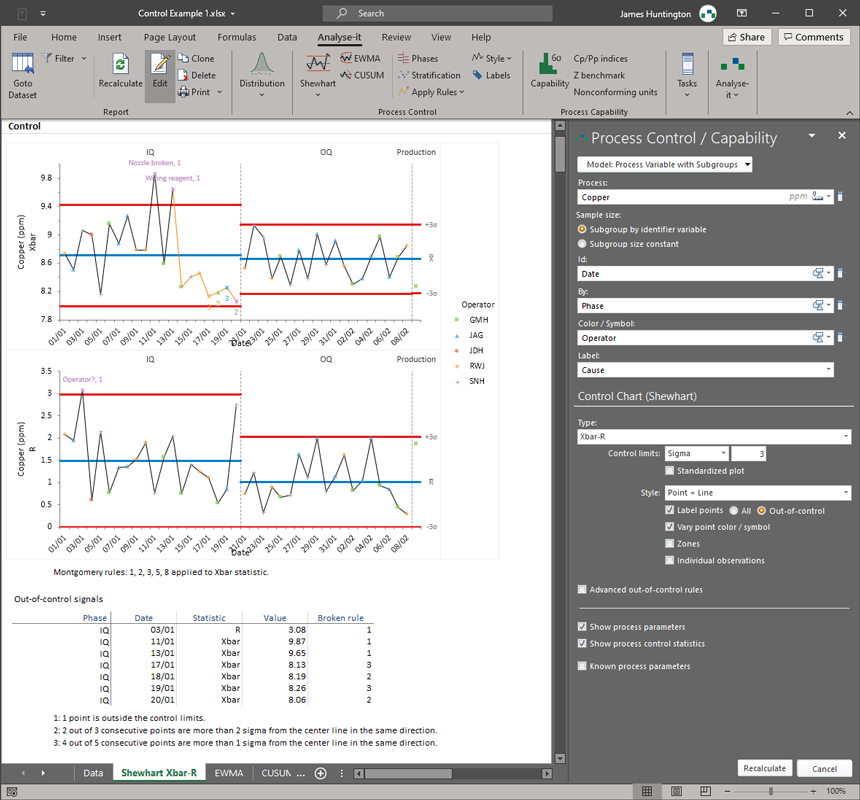
Analyse-it covers the full SPC workflow in one package. Shewhart variable charts � Xbar-R, Xbar-S, I-MR, and individual component charts � for continuous measurement data. Attribute charts � p, np, c, and u � for defective items, defects per unit, and counts. Time-weighted CUSUM, EWMA, and UWMA charts for detecting small, sustained shifts that Shewhart charts miss. WECO, Nelson, and Montgomery detection rules applied automatically. Phases to track performance before and after a process change. Stratification by operator, shift, machine, or any factor to identify contributing sources of variation that aggregate charts hide.
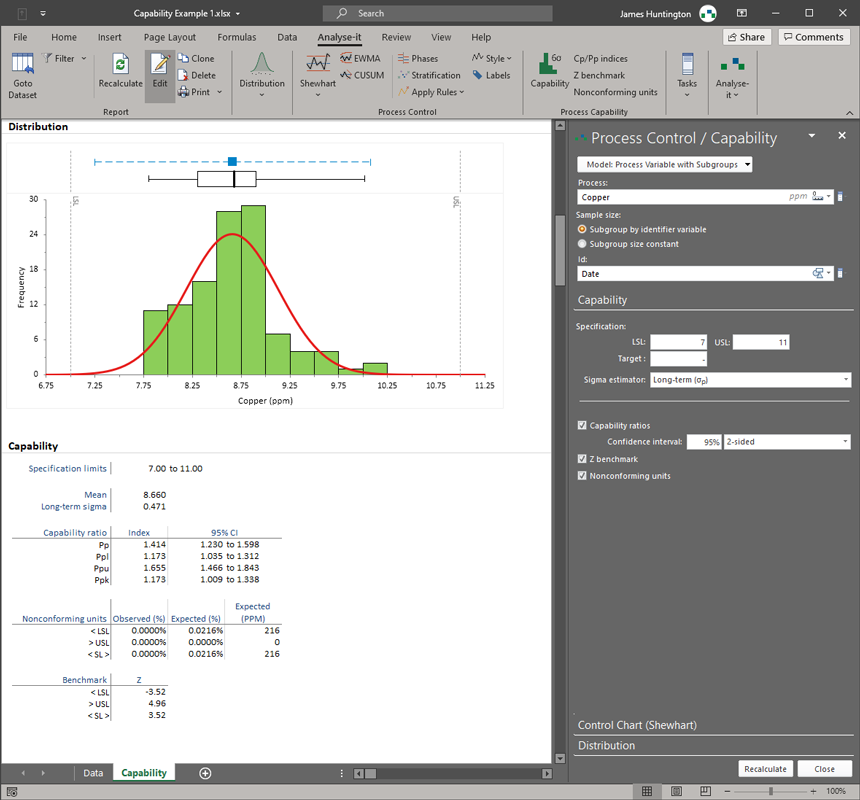
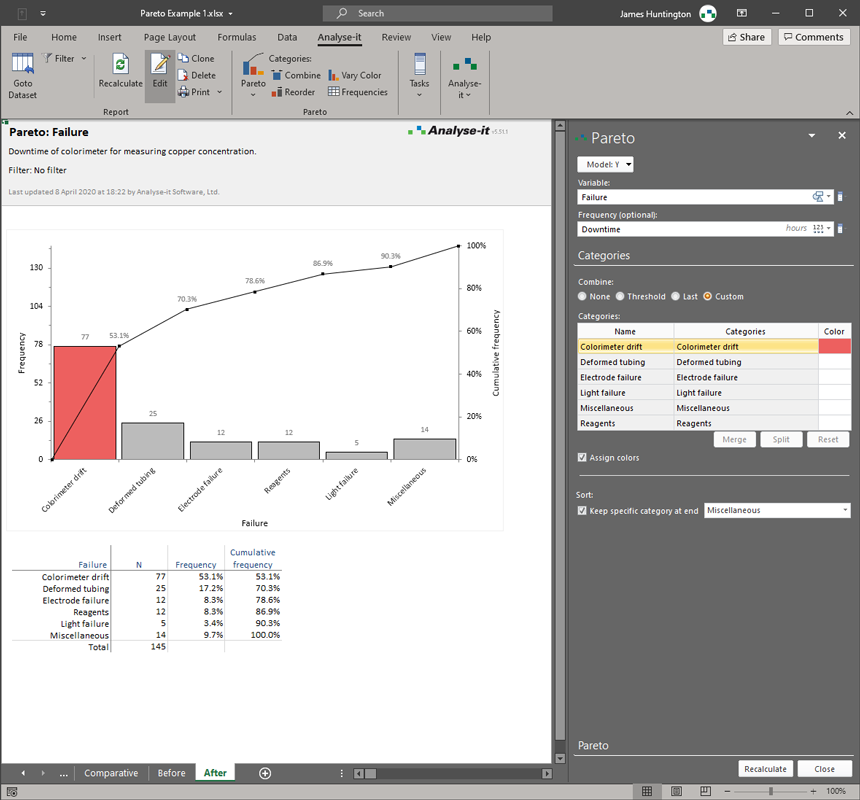
Control charts tell you the process is stable. Process capability analysis tells you whether a stable process actually meets the specification. Analyse-it includes both in the same package � run the control chart, confirm the process is in control, then assess capability with Cp, Cpk, Pp, Ppk, Cpm, Z-benchmark, and sigma level. When the data is non-normal � which is common in real production � Box-Cox and other power transformations bring it into a form where capability indices remain valid. The normal Q-Q plot makes it straightforward to assess whether transformation is needed and whether it worked. Pareto analysis identifies the vital few causes driving defects or variation, with one-way and two-way comparative charts to break down by operator, shift, or product line.
75,000 researchers, analysts, and scientists at leading universities, hospitals, and companies worldwide have relied on Analyse-it for over 30 years.
What's included
-
Bring processes under control with Shewhart charts
Xbar-R, Xbar-S, Xbar, R, S, I-MR, I, and MR charts for continuous data. p, np, c, and u charts for attribute data. WECO, Nelson, and Montgomery detection rules flag out-of-control points automatically. Phases for before-and-after comparison. Stratification by any factor. See control chart details.
-
Detect small shifts before they become big problems
CUSUM, EWMA, and UWMA time-weighted control charts for detecting small, sustained shifts in the process mean that Shewhart charts are less sensitive to. Particularly useful in processes where small drifts accumulate into significant quality or compliance problems.
-
Determine whether your process meets specifications
Cp, Cpl, Cpu, Cpk, Cpm, Pp, Ppl, Ppu, Ppk, Z-benchmark, sigma level, and nonconforming unit estimation � all with confidence intervals. Histogram with specification limits and normal Q-Q plot. Box-Cox and other transformations for non-normal data. See capability analysis details.
-
Identify where to focus improvement effort
Pareto charts to identify the most frequently occurring defects and prioritise action. One-way and two-way comparative charts to analyse by operator, shift, machine, or product line. Merge, reorder, and colour bars to highlight the most important categories. See Pareto analysis details.
-
Confirm root causes and quantify improvements
Hypothesis tests, regression, and ANOVA to confirm that a suspected root cause is real and that an improvement made a statistically significant difference � not just a difference that looks good on a chart. The statistical tools the Analyse and Improve phases of DMAIC require.
-
Part of the Quality Control and Improvement edition
SPC is part of the QC and Improvement edition, which covers the complete DMAIC statistical workflow � control charts, capability analysis, Pareto analysis, hypothesis tests, and regression. One package for the Measure, Analyse, Improve, and Control phases of your improvement projects.
Trusted by 75,000 researchers, analysts, and scientists at leading universities, hospitals, and companies worldwide � for over 30 years.
Try free for 15 days