A capability index calculated from an unstable process is a meaningless number. An index calculated from non-normal data is a misleading number. Both mistakes are common, and both happen more easily when control charts and capability analysis live in separate tools — it becomes tempting to skip the stability check, or to run the indices without assessing the distribution first.
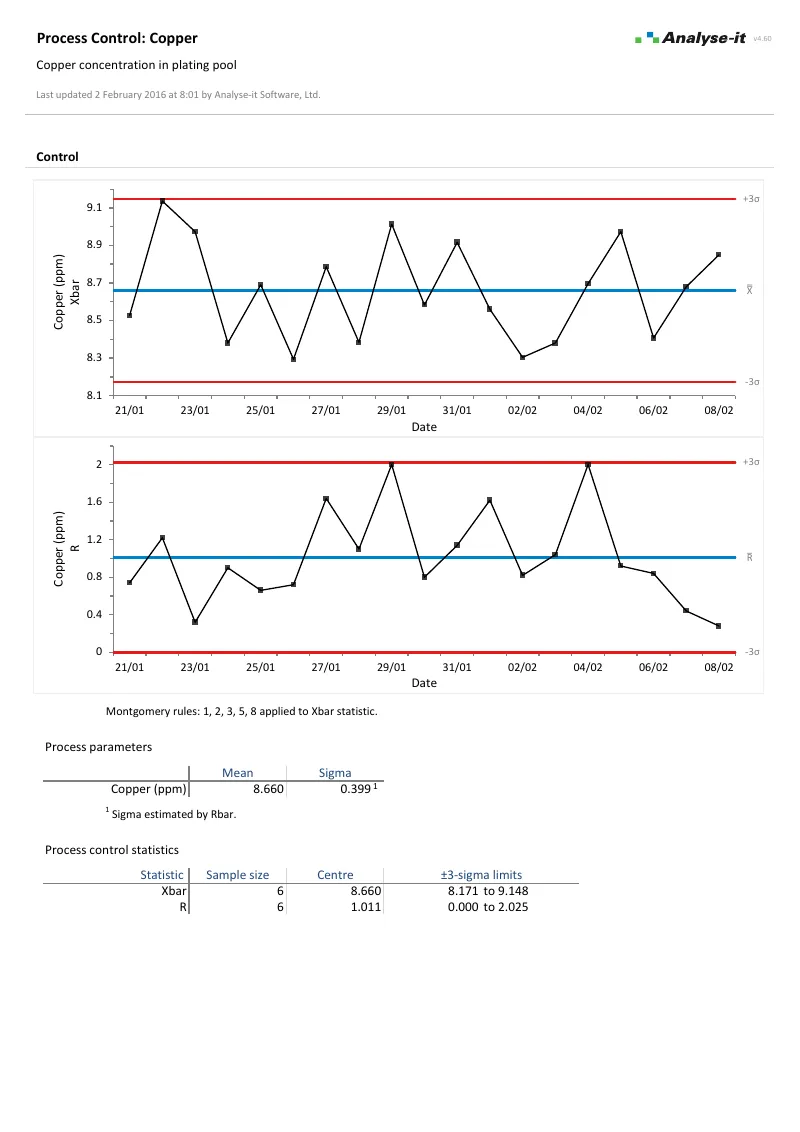
Analyse-it includes control charts and capability analysis in the same package, so the workflow stays in one workbook: confirm stability with a Shewhart chart, check the distribution with a Q-Q plot, transform if necessary, then calculate the indices. Capability indices (Cp, Cpk, Cpm) and performance indices (Pp, Ppk) are reported separately, all with confidence intervals. Z-benchmark, sigma level, and nonconforming unit estimation complete the picture for Six Sigma programmes.
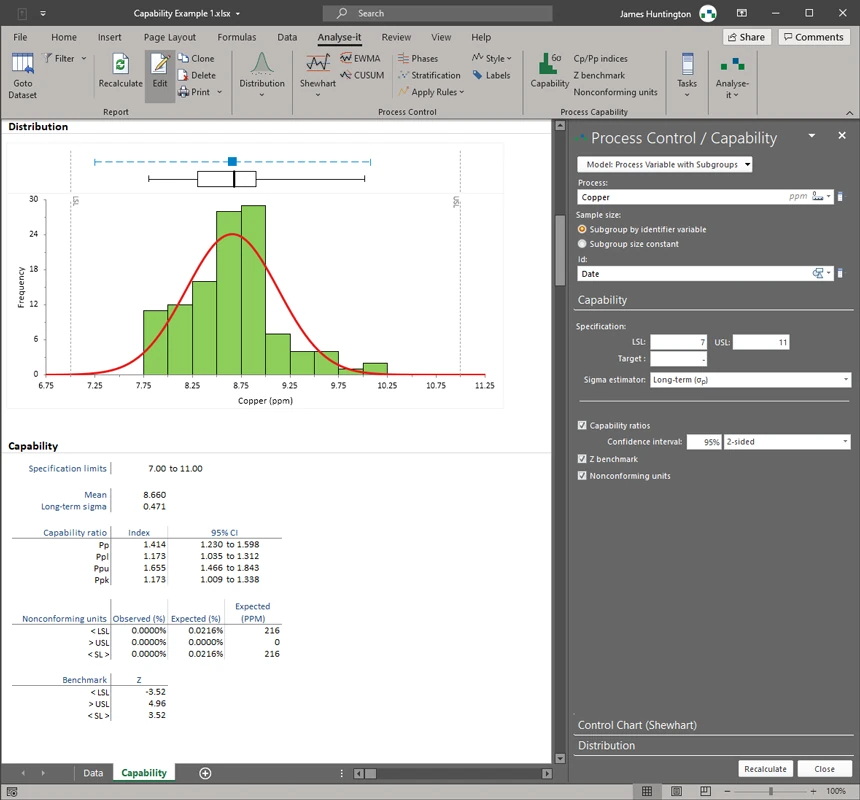
See capability output in detail — histogram with specification limits, capability and performance indices with confidence intervals, Q-Q plot, and nonconforming unit estimation.
Capability analysis is one part of the complete SPC and improvement toolkit. The Quality Control & Improvement edition also includes Shewhart, CUSUM, and EWMA control charts with detection rules, phases, and stratification, and Pareto analysis for identifying the vital few defect categories, plus the full Standard edition with hypothesis tests, ANOVA, and regression. See everything in the Quality Control & Improvement edition →