Statistics add-in software for statistical analysis in Excel
  • Statistical Reference Guide
  • Principal component analysis (PCA)

Biplot

A biplot simultaneously plots information on the observations and the variables in a multidimensional dataset.

A biplot can optimally represent any two of the following characteristics:
  • distances between observations
  • relationships between variables
  • inner products between observations and variables
There are 3 types of biplot based on which of these characteristics they represent:
Type Characteristics
PCA Distances between the observations and also the inner products between observations and variables.
Covariance / Correlation Relationships between the variables and the inner products between observations and variables.
Joint Distances between observations and also the relationship between variables.

A 2-dimensional biplot represents the information contained in two of the principal components. It is an approximation of the original multidimensional space.

Classic biplot


PCA Gabriel bi-plot

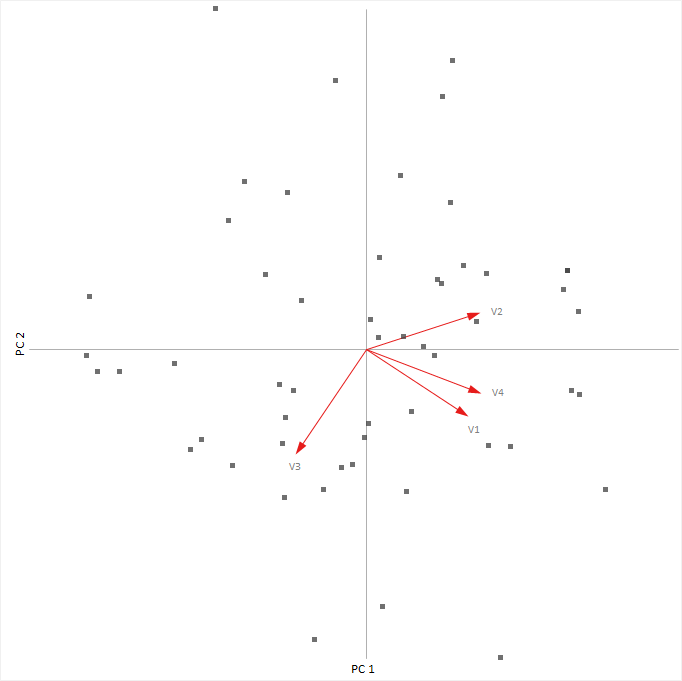
The classical biplot (Gabriel 1971) plots points representing the observations and vectors representing the variables.

PCA biplot


PCA Gower-Hand bi-plot

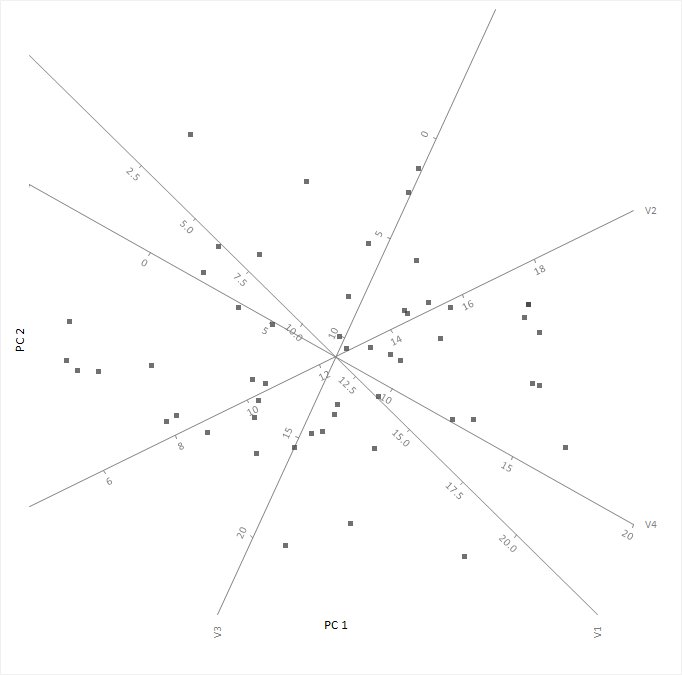
A more recent innovation, the PCA biplot (Gower & Hand 1996), represents the variables with calibrated axes and observations as points allowing you to project the observations onto the axes to make an approximation of the original values of the variables.

Related concepts
Monoplot
Related tasks
Creating a biplot
Related information
Gower, J. C., Lubbe, S. G., & Le Roux, N. J. (2011). Understanding Biplots. John Wiley & Sons.
Gabriel, K. R. (1971). The biplot graphic display of matrices with application to principal component analysis. Biometrika, 58(3), 453-467.
Available in Analyse-it Editions
Standard edition
Method Validation edition
Quality Control & Improvement edition
Ultimate edition

  •  What is Analyse-it?
  •  What's new?
  •  Administrator's Guide
  •  User's Guide
  •  Statistical Reference Guide
  •  Distribution
  •  Compare groups
  •  Compare pairs
  •  Contingency tables
  •  Correlation and association
  •  Principal component analysis (PCA)
  •  Principal components
  •  Scree plot
  •  Calculating principal components
  •  Biplot
  •  Monoplot
  •  Creating a biplot
  •  Creating a correlation monoplot
  •  Factor analysis (FA)
  •  Item reliability
  •  Fit model
  •  Method comparison / Agreement
  •  Measurement systems analysis (MSA)
  •  Reference interval
  •  Diagnostic performance
  •  Survival/Reliability
  •  Control charts
  •  Process capability
  •  Pareto analysis
  •  Study Designs
  •  Bibliography


Version 6.15
Published 18-Apr-2023
statistics software, statistical software for Excel
  • Products
  • Store 
  • Support
  • Blog
  • About us
  • Download trial
  •  Search
  •  Sign in
  •  Contact us
Analyse-it editions
  • Standard edition
  • Medical edition
  • Method Validation edition
  • Quality Control & Improvement edition
  • Ultimate edition

  • Blog  
  • About us
  • Contact us  
  • Privacy policy


Copyright 2026 Analyse-it Software, Ltd, Leeds, United Kingdom .
We use essential cookies to run the site, and optional analytics to improve the experience for visitors. For more information see our Privacy policy.