Analyse-it
Analyse-it
  • Products
  • Pricing
  • Support
  • About us
Download trial Sign in
  • Statistical Reference Guide
  • Distribution
  • Continuous distributions
  • Univariate plot

Box plot

A box plot shows the five-number summary of the data – the minimum, first quartile, median, third quartile, and maximum. An outlier box plot is a variation of the skeletal box plot that also identifies possible outliers.

Skeletal box plot


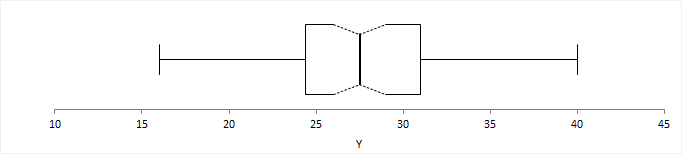
A skeletal box plot shows the median as a line, a box from the 1st to 3rd quartiles, and whiskers with end caps extending to the minimum and maximum. Optional notches in the box represent the confidence interval around the median.

Outlier box plot


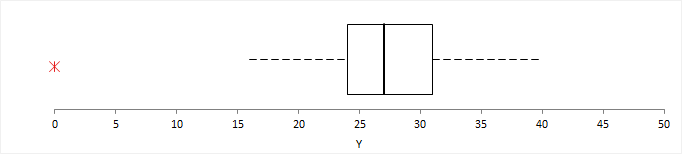
An outlier box plot is a variation of the skeletal box plot, but instead of extending to the minimum and maximum, the whiskers extend to the furthest observation within 1.5 x IQR from the quartiles. Possible near outliers (orange plus symbol) are identified as observations further than 1.5 x IQR from the quartiles, and possible far outliers (red asterisk symbol) as observations further than 3.0 x IQR from the quartiles. You should investigate each possible outlier before deciding whether to exclude it, as even in normally distributed data, an outlier box plot identifies approximately 0.7% of observations as possible outliers.

Quantile box plot


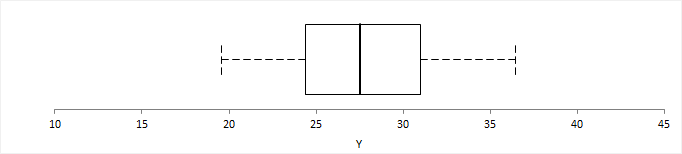
A quantile box plot is a variation on the skeletal box plot and shows the whiskers extending to specific quantiles rather than the minimum and maximum value.

Related concepts
Dot plot
Mean plot
Related tasks
Creating a univariate plot
Available in Analyse-it Editions
Standard edition
Method Validation edition
Quality Control & Improvement edition
Ultimate edition

  •  What is Analyse-it?
  •  What's new?
  •  Administrator's Guide
  •  User's Guide
  •  Statistical Reference Guide
  •  Distribution
  •  Continuous distributions
  •  Univariate descriptive statistics
  •  Calculating univariate descriptive statistics
  •  Univariate plot
  •  Dot plot
  •  Box plot
  •  Mean plot
  •  Creating a univariate plot
  •  Frequency distribution
  •  Normality
  •  Inferences about distribution parameters
  •  Discrete distributions
  •  Study design
  •  Compare groups
  •  Compare pairs
  •  Contingency tables
  •  Correlation and association
  •  Principal component analysis (PCA)
  •  Factor analysis (FA)
  •  Item reliability
  •  Fit model
  •  Method comparison / Agreement
  •  Measurement systems analysis (MSA)
  •  Reference interval
  •  Diagnostic performance
  •  Survival/Reliability
  •  Control charts
  •  Process capability
  •  Pareto analysis
  •  Study Designs
  •  Bibliography


Version 6.15
Published 18-Apr-2023
Products
  • Standard Edition
  • Medical Edition
  • Quality Control & Improvement Edition
  • Method Validation Edition
  • Ultimate Edition
  • Compare Editions
  • Pricing
Support
  • Documentation
  • Tutorials
  • Download latest version
  • Release history
  • Contact support
Company
  • About us
  • Blog
  • Contact us
  • Privacy policy

Get Started

  • Download free trial
  • Sign In

© 2026 Analyse-it Software, Ltd. All rights reserved.

Statistical analysis and method validation software for Microsoft Excel.

We use essential cookies to run the site, and optional analytics to improve the experience for visitors. For more information see our Privacy policy.