Dot plot
A dot plot, also known as a strip plot, shows the individual observations.
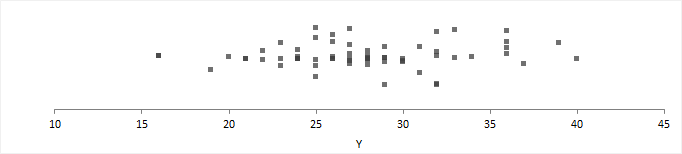
A dot plot gives an indication of the spread of the data and can highlight clustering or extreme values.
Related tasks
Available in Analyse-it Editions
Standard edition
Method Validation edition
Quality Control & Improvement edition
Ultimate edition
Standard edition
Method Validation edition
Quality Control & Improvement edition
Ultimate edition