
Color map
A color map highlights the sign and magnitude of coefficients in a patterned matrix.
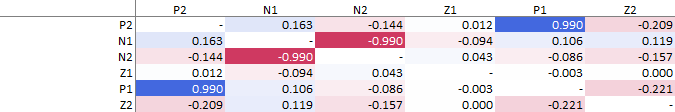
Red indicate negative values, blue indicates positive values. Intensity of the color represents the magnitude of the value, the darker more extreme.
Available in Analyse-it Editions
Standard edition
Method Validation edition
Quality Control & Improvement edition
Ultimate edition
Standard edition
Method Validation edition
Quality Control & Improvement edition
Ultimate edition