Exponentially Weighted Moving Average (EWMA) chart
An exponentially weighted moving average (EWMA) chart is a type of control chart used to monitor small shifts in the process mean. It weights observations in geometrically decreasing order so that the most recent observations contribute highly while the oldest observations contribute very little.
Given a series of observations and a fixed weight, the first element of the exponentially weighted moving average is computed by taking the (1-weight) * previous EWMA + (weight * current observation). Then the current observation is modified by "shifting forward"; and repeating the calculation. This process is repeated over the entire series creating the exponentially weighted moving average statistic.
- A weight for the most recent observation. Weight must satisfy 0 < weight ≤ 1. Default weight=0.2.
The "best" value is a matter of personal preference and experience. A small weight reduces the influence of the most recent sample; a large value increases the influence of the most recent sample. A value of 1 reduces the chart to a Shewhart Xbar chart. Recommendations suggest a weight between 0.05 and 0.25 (Montgomery 2012).
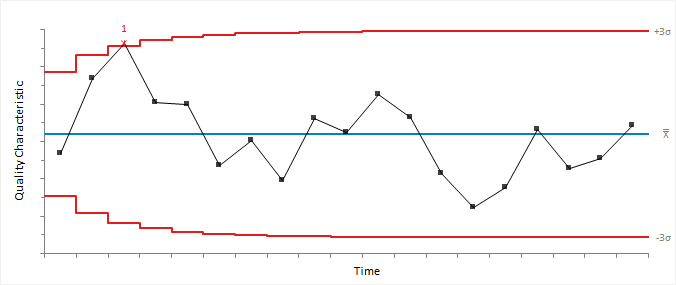
It is possible to modify the EWMA, so it responds more quickly to detect a process that is out-of-control at start-up. This modification is done using a further exponentially decreasing adjustment to narrow the limits of the first few observations (Montgomery 2012).
Each point on the chart represents the value of the exponentially weighted moving average.
The center line is the process mean. If unspecified, the process mean is the weighted mean of the subgroup means or the mean of the individual observations.
The control limits are a multiple (L) of sigma above and below the center line. Default L=3. If unspecified, the process sigma is the pooled standard deviation of the subgroups, or the standard deviation of the individual observations, unless the chart is combined with an R-, S-, or MR- chart where it is estimated as described for the respective chart.
Because the EWMA is a weighted average of all past and the current observations, it is very insensitive to the assumption of normality. It is, therefore, an ideal replacement for a Shewhart I-chart when normality cannot be assumed.
Like the CUSUM, EWMA is sensitive to small shifts in the process mean but does not match the ability of a Shewhart chart to detect larger shifts. For this reason, it is sometimes used together with a Shewhart chart (Montgomery 2012).