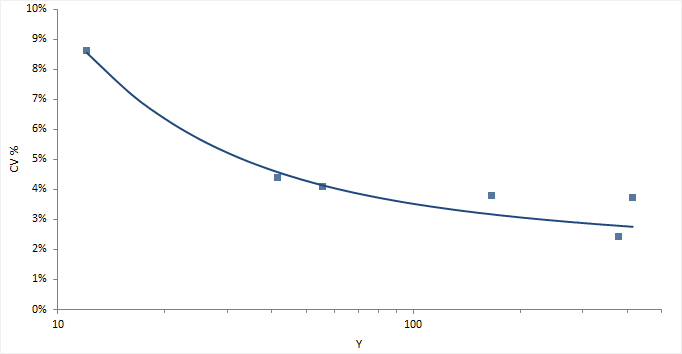
Precision profile plot
A precision profile plot shows precision against the measured quantity value over the measuring interval.

Related concepts

A precision profile plot shows precision against the measured quantity value over the measuring interval.

