Analyse-it
Analyse-it
  • Products
  • Pricing
  • Support
  • About us
Download trial Sign in
  • Statistical Reference Guide
  • Diagnostic performance

ROC plot

ROC (receiver operating characteristic) curves show the ability of a quantitative diagnostic test to classify subjects correctly as the decision threshold is varied.

The ROC plot shows sensitivity (true positive fraction) on the horizontal axis against 1-specificity (false positive fraction) on the vertical axis over all possible decision thresholds.


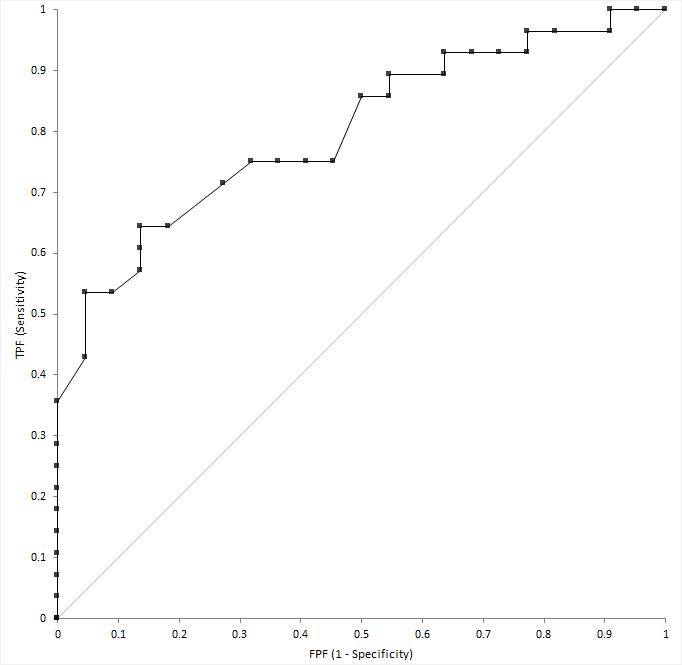
A diagnostic test able to perfectly identify subjects with and without the condition produces a curve that passes through the upper left corner (0, 1) of the plot. A diagnostic test with no ability to discriminate better than chance produces a diagonal line from the origin (0, 0) to the top right corner (1, 1) of the plot. Most tests lie somewhere between these extremes. If a curve lies below the diagonal line (0, 0 to 1, 1), you can invert it by swapping the decision criteria to produce a curve above the line.

An empirical ROC curve is the simplest to construct. Sensitivity and specificity use the empirical distributions for the subjects with and without the condition. This method is nonparametric because no parameters are needed to model the behavior of the curve, and it makes no assumptions about the underlying distribution of the two groups of subjects.

Related concepts
Area under the curve (AUC)
Related tasks
Plotting a single ROC curve
Comparing two or more ROC curves
Related information
Zweig, M. H., & Campbell, G. (1993). Receiver-operating characteristic (ROC) plots: a fundamental evaluation tool in clinical medicine. Clinical Chemistry, 39(4), 561-577.
Zhou, X. H., Obuchowski, N. A., & McClish, D. K. (2011). Statistical methods in diagnostic medicine. Wiley-Blackwell.
Liu, A., & Bandos, A. I. (2012). Statistical evaluation of diagnostic performance: topics in ROC analysis. CRC Press.
Pepe, M. S. (2003). The statistical evaluation of medical tests for classification and prediction. Oxford University Press.
Available in Analyse-it Editions
Method Validation edition
Ultimate edition

  •  What is Analyse-it?
  •  What's new?
  •  Administrator's Guide
  •  User's Guide
  •  Statistical Reference Guide
  •  Distribution
  •  Compare groups
  •  Compare pairs
  •  Contingency tables
  •  Correlation and association
  •  Principal component analysis (PCA)
  •  Factor analysis (FA)
  •  Item reliability
  •  Fit model
  •  Method comparison / Agreement
  •  Measurement systems analysis (MSA)
  •  Reference interval
  •  Diagnostic performance
  •  Measures of diagnostic accuracy
  •  Estimating sensitivity and specificity of a diagnostic test
  •  Comparing the sensitivity and specificity two diagnostic tests
  •  ROC plot
  •  Plotting a single ROC curve
  •  Comparing two or more ROC curves
  •  Area under the curve (AUC)
  •  Testing the area under the curve
  •  Difference between the areas under two curves
  •  Testing the difference between the areas under two curves
  •  Decision thresholds
  •  Decision plot
  •  Finding the optimal decision threshold
  •  Predicting the decision threshold
  •  Study design
  •  Survival/Reliability
  •  Control charts
  •  Process capability
  •  Pareto analysis
  •  Study Designs
  •  Bibliography


Version 6.15
Published 18-Apr-2023
Products
  • Standard Edition
  • Medical Edition
  • Quality Control & Improvement Edition
  • Method Validation Edition
  • Ultimate Edition
  • Compare Editions
  • Pricing
Support
  • Documentation
  • Tutorials
  • Download latest version
  • Release history
  • Contact support
Company
  • About us
  • Blog
  • Contact us
  • Privacy policy

Get Started

  • Download free trial
  • Sign In

© 2026 Analyse-it® Software, Ltd. All rights reserved.

Statistical analysis and method validation software for Microsoft Excel.

We use essential cookies to run the site, and optional analytics to improve the experience for visitors. For more information see our Privacy policy.