Decision plot
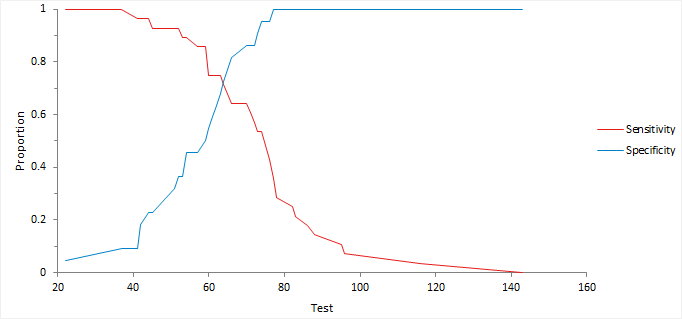
A decision plot shows a measure of performance (such as sensitivity, specificity, likelihood ratios, or predictive values) against all decision thresholds to help identify optimal decision threshold.
Related concepts

A decision plot shows a measure of performance (such as sensitivity, specificity, likelihood ratios, or predictive values) against all decision thresholds to help identify optimal decision threshold.