ROC curve analysis and diagnostic performance software per CLSI EP24-A2 ROC curves, AUC with DeLong confidence intervals, test comparison, optimal threshold determination, sensitivity, specificity, likelihood ratios, and predictive values — covering both quantitative test evaluation (EP24-A2) and qualitative test evaluation (EP12-A2).
Try free for 15 days — no credit card required
![]()
Rated best ROC curve software — Clinical Chemistry, March 2003.
Trusted by 75,000 scientists at most of the top-10 IVD manufacturers, and at thousands of ISO 15189, ISO/IEC 17025, and CLIA-regulated laboratories worldwide for over 30 years.
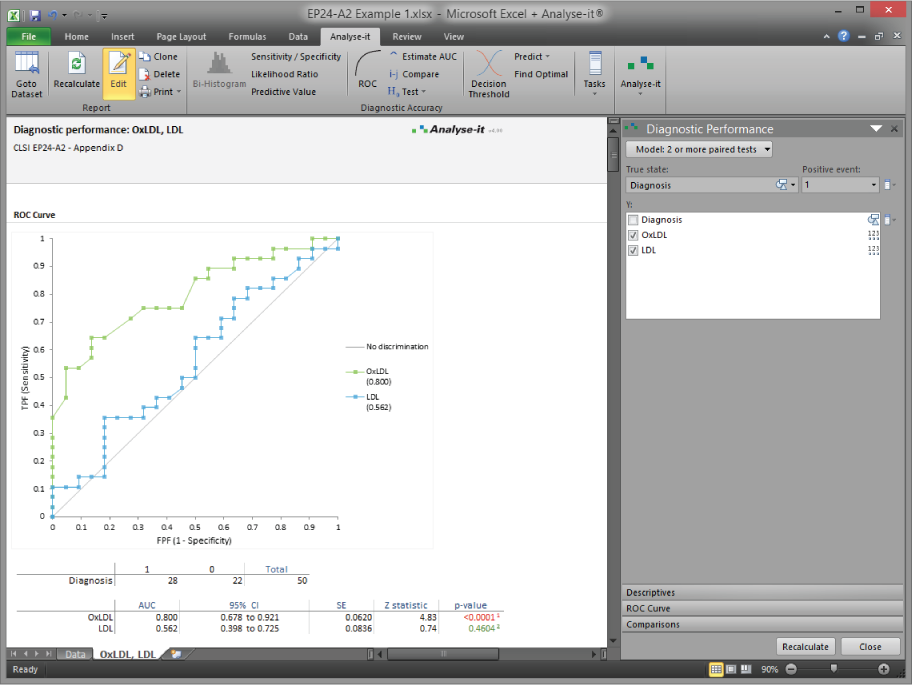
Compare tests with statistical rigour
Overlay ROC curves and compare AUC values using the DeLong method — for paired and unpaired designs. Determine whether the difference between tests is statistically significant, not just visually apparent.
Validated for regulatory submission
Every calculation runs in Analyse-it's own engine — no Excel formulas, no third-party functions. Follows CLSI EP24-A2 for quantitative tests and EP12-A2 for qualitative tests. Defensible in a 510(k), CE-IVD technical file, CAP inspection, or ISO 15189 audit.
Data stays in your facility
Analyse-it runs entirely within Microsoft Excel on your PC. No cloud processing, no data transmission — your pre-submission and patient-adjacent data stays within your facility under your data governance controls.
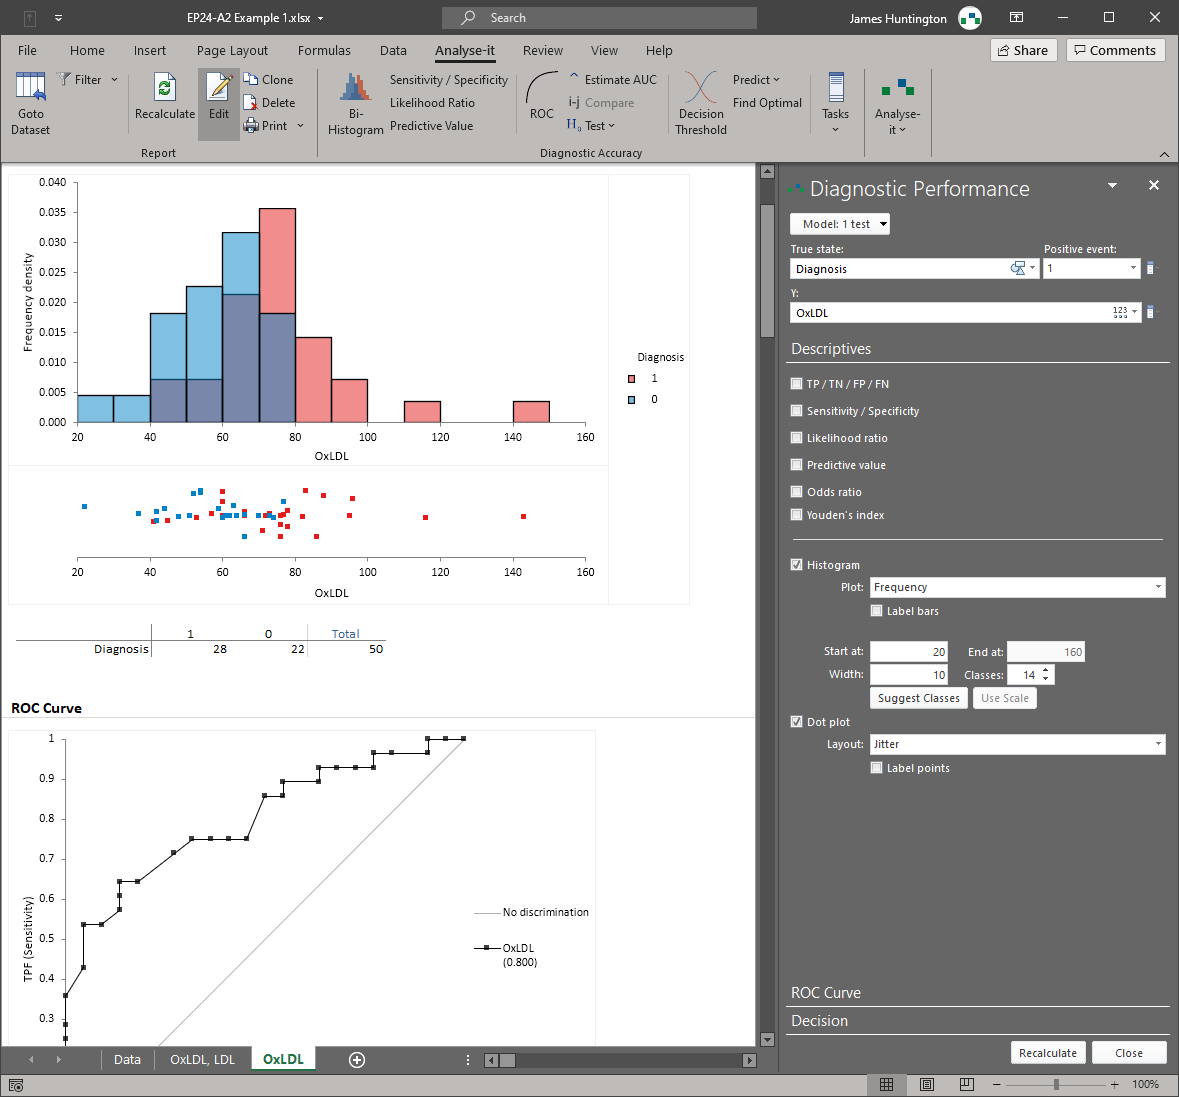
A basic ROC curve is straightforward. The hard part is everything around it: choosing the right threshold for a clinical context where the costs of false positives and false negatives are asymmetric, comparing two tests statistically rather than by eye, producing confidence intervals that regulators and reviewers expect to see, and handling the distinction between quantitative tests (where the threshold is a continuous measurement) and qualitative tests (where it is not). Most implementations produce the curve and the AUC. Analyse-it covers the full diagnostic performance workflow specified in CLSI EP24-A2 and EP12-A2.
AUC with DeLong confidence intervals and hypothesis tests for comparing paired and unpaired ROC curves. Sensitivity, specificity, positive and negative likelihood ratios, and predictive values at every threshold, with confidence intervals throughout. Optimal threshold determination by Youden index, cost-based optimisation, or constraints on minimum sensitivity or specificity — depending on the clinical question. An interactive threshold exploration that shows how changing the decision point affects misclassification rates, so you can see the trade-off before committing. For qualitative tests, EP12-A2 evaluation of sensitivity, specificity, and agreement against a reference standard.
Diagnostic performance analysis rarely stands alone in a method validation workflow. A new IVD product needs ROC analysis to establish diagnostic accuracy, but it also needs method comparison to demonstrate equivalence with the predicate, precision studies to establish repeatability, and reference intervals for product labelling. Analyse-it covers all of these in the same validated package — switch from ROC analysis to method comparison to reference intervals without leaving Excel or re-importing data.
Scientists at Abbott, Roche, Thermo Fisher, and most of the world's leading IVD manufacturers have relied on Analyse-it for diagnostic performance analysis for over 30 years — as have clinical researchers publishing ROC studies in peer-reviewed journals and clinical laboratories evaluating test performance during analyser verification.
Seen in the field
What's included
-
Establish diagnostic accuracy with AUC and confidence intervals
ROC curve with AUC and DeLong confidence intervals. Sensitivity, specificity, positive and negative likelihood ratios, and predictive values at every threshold — all with confidence intervals. Follows CLSI EP24-A2 for quantitative diagnostic tests.
-
Compare diagnostic tests statistically
Overlay ROC curves for two or more tests and compare AUC values using the DeLong method. Paired comparison for tests measured on the same subjects, unpaired for independent groups. Statistical tests and confidence intervals for the difference in AUC.
-
Find the optimal decision threshold for your clinical context
Youden index for maximum overall accuracy. Cost-based optimisation when false positives and false negatives carry different consequences. Constrained optimisation to maintain a minimum sensitivity or specificity. Interactive threshold exploration to see the effect of different cut-points on misclassification rates.
-
Evaluate qualitative test performance per EP12-A2
For qualitative tests where the result is positive or negative rather than a continuous measurement. Sensitivity, specificity, and agreement against a reference standard per CLSI EP12-A2. Confidence intervals for all estimates.
-
Assess performance across subgroups
Evaluate diagnostic accuracy across different populations or clinical strata. Determine whether test performance varies by subgroup — important for product labelling and for identifying populations where the test may perform differently.
-
Validated engine you can defend at inspection
Every calculation runs in Analyse-it's own engine — no Excel formulas or third-party functions. Validated against published reference datasets before every release. See the development and validation process.
-
Part of the Method Validation edition
ROC curve analysis is included in the Method Validation edition, which covers the full CLSI method validation workflow — measurement system analysis (EP05-A3, EP06-A, EP15-A3, EP17-A2), method comparison (EP09-A3, EP21-A), reference intervals (EP28-A3C), and total analytical error (EP21-A). One tool for everything your laboratory or IVD submission requires.
Trusted by 75,000 scientists at most of the top-10 IVD manufacturers, and at thousands of ISO 15189, ISO/IEC 17025, and CLIA-regulated laboratories worldwide for over 30 years.
Try free for 15 days — no credit card required
See all Method Validation features
Pricing and licensing
Reference lab case study