Passing-Bablok regression for method comparison The complete EP09-A3 Passing-Bablok implementation — both 1983 and 1988 methods, bootstrap confidence intervals, CUSUM linearity testing, bias at clinical decision points, replicate support, interval partitioning, and total analytical error per EP21-A.

The non-parametric starting point for method comparison

Passing-Bablok is often the first regression you run in a method comparison study. It makes no distributional assumptions, is inherently resistant to outliers, and doesn’t require you to know the precision ratio between methods — which means it works when the other regressions might not. But the slope and intercept are only useful if the linear model actually holds across the range. If it doesn’t, the bias estimate is misleading and any conclusions drawn from it are unreliable.

Analyse-it implements both the original 1983 and the extended 1988 Passing-Bablok methods, with CUSUM linearity testing built into the same analysis so you know immediately whether the linear assumption holds. When it doesn’t, partition the measuring range and fit separate regressions rather than forcing a single line across a nonlinear relationship.

Analyse-it has a tremendous advantage in its ease of use. With other programs, you really have to study how to use them, but Analyse-it makes it so easy, and at the same time offers the advanced procedures we need like Weighted Deming regression.
Marco Balerna, Ph.D.
Clinical Chemist
Ente Ospedaliero Cantonale, Switzerland
Read the case study →

What's included

Slope and intercept with bootstrap and normal CIs

Both the 1983 and 1988 Passing-Bablok methods. The 1988 method handles tied slopes more robustly for larger datasets. Slope and intercept with bootstrap confidence intervals for reliable coverage without distributional assumptions, or normal approximation CIs for comparison with published results. Scatter plot with fitted regression line, confidence bands, identity line, and equation.

CUSUM linearity test with exact p-values

Verify the linear assumption holds across the measuring range before committing to the regression. CUSUM linearity plot with exact p-values — not just a pass/fail. If linearity doesn’t hold, partition the measuring range into intervals or switch to a different approach.

Bias at clinical decision points with equality and equivalence tests

Predict mean bias with confidence intervals at any decision threshold you specify. Test equality (is there a significant difference?) and equivalence (is the difference within what’s clinically acceptable?) at each point per EP09-A3. Allowable difference as absolute concentration, percentage, or a combination — such as “10%, with a minimum of 5 mg/dL.”

Partition the measuring range

Partition the data into separate measuring intervals, each with its own regression, bias estimates, and comparability assessment. Use any fit within each interval — Passing-Bablok in one, Bland-Altman or Deming in another. Each interval gets its own allowable difference specification per EP09-A3.

Replicate measurements with correct variance

Singlicate, duplicate, or any number of replicates. Within-subject variation estimated directly from the replicate structure and confidence intervals adjusted accordingly — not approximated by averaging.

Total analytical error per EP21-A

Combine the bias estimate with the imprecision of the test method and compare the total against allowable error at each decision point. One pass/fail assessment that accounts for both bias and imprecision.

Example analyses

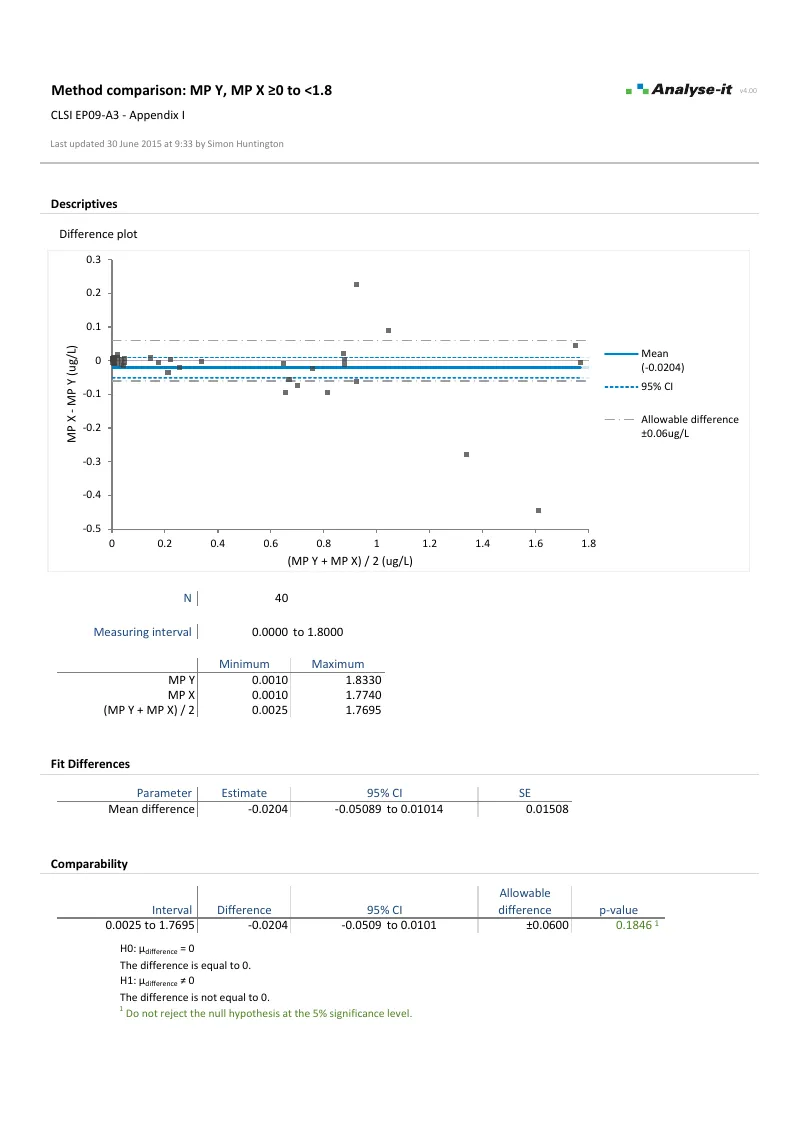
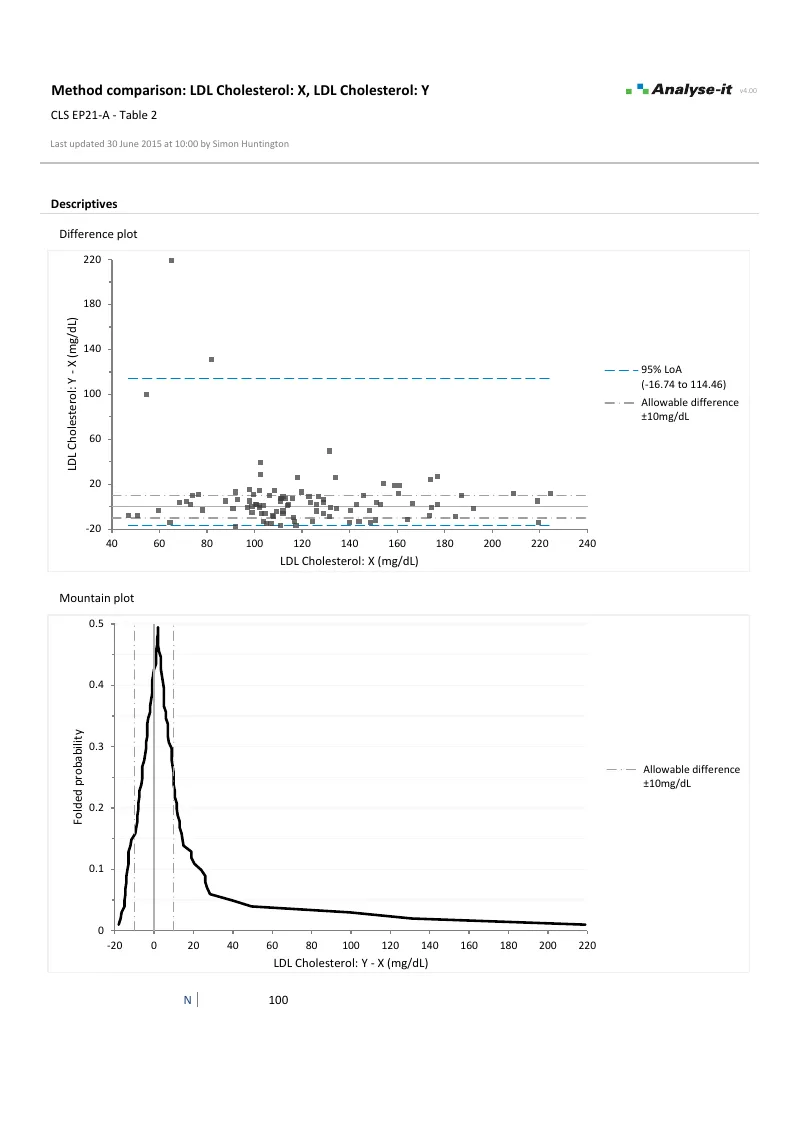
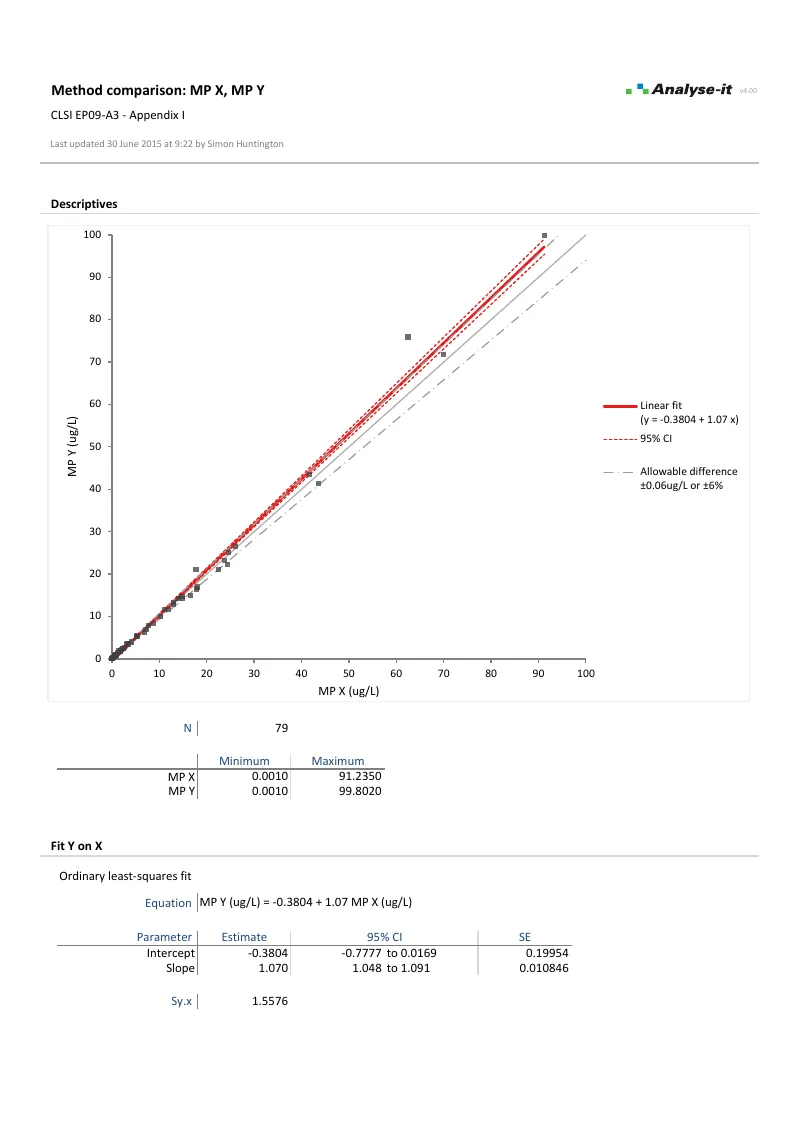
See Passing-Bablok regression results in detail — scatter plots, bias at decision points, and CUSUM linearity testing — using CLSI example datasets you can download and follow along with.

EP09 A3 Example 2 EP09-A3 — Appendix I
All five fits with decision point testing.
79 observations. Passing-Bablok alongside OLS, Weighted OLS, Deming, and Weighted Deming. Bias at decision point 5 μg/L with CI and equality test.
EP09 A3 Example 1 EP09-A3 — Appendix I
Partitioned measuring range.
Measuring range partitioned into 0 to 1.8 μg/L and 1.8 to 100 μg/L with different allowable differences per interval.
EP21 A Example 1 EP21-A — Table 2
LDL Cholesterol total analytical error.
100 observations. Mountain plot, limits of agreement, and allowable difference ±10 mg/dL.

Part of the method comparison workflow

Passing-Bablok is one of five regression methods in the method comparison analysis. For a parametric approach, see Deming and Weighted Deming regression. To see the distribution of differences and limits of agreement, see Bland-Altman.

Software you can trust

Validated calculations you can defend at inspection Every calculation is performed by Analyse-it — no Excel formulas, no third-party functions. Results are validated against CLSI reference datasets, published datasets, and thousands of internal test cases before every release. See how we develop and validate Analyse-it →
Data stays in your facility Analyse-it runs entirely within Microsoft Excel on your PC. No cloud processing, no data transmission. Pre-submission data, patient-adjacent data, and in-process results stay within your facility under your own data governance controls.
Standard Excel workbooks anyone can open Every analysis is an ordinary .xlsx workbook. Share with colleagues, submit to regulatory affairs, archive for audit, open on any PC with Excel. No proprietary format, no licence required to view results. Colleagues and auditors see exactly what you see.
Results that can’t be accidentally broken Analysis output contains computed values, not formulas. Nothing to accidentally overwrite, no cell references to break, no formula errors to introduce. The results you reported are exactly what you’ll find when you reopen the workbook months or years later for an audit.

Technical details

CLSI protocols

  • EP09-A3: Measurement Procedure Comparison and Bias Estimation Using Patient Samples
  • EP21-A: Estimation of Total Analytical Error for Clinical Laboratory Methods

Passing-Bablok regression

  • Original 1983 Passing-Bablok method
  • 1988 Passing-Bablok method
  • Bootstrap confidence intervals
  • Normal approximation confidence intervals
  • Slope and intercept

Bias estimation

  • Predict bias at clinical decision points
  • Equality and equivalence tests at decision points
  • Allowable error: absolute, percentage, or combination

Study design

  • Singlicate, duplicate, and replicate measurements
  • Reduce or partition measuring interval new in v4.00
  • Total analytical error per EP21-A

Diagnostics

  • CUSUM linearity test with exact p-values
  • Kolmogorov-Smirnov linearity test
  • Pearson r correlation coefficient
  • Precision (SD or CV) for each method

Plots

  • Scatter plot with fit line, confidence bands, identity line, and equation
  • Scatter plot with allowable error bands
  • Difference / relative difference / ratio plot
  • Difference plot with allowable difference band and histogram
  • Mountain plot with allowable difference band new in v3.71
  • Residual plot (raw and standardised) with histogram
  • CUSUM linearity plot
  • Vary colour of points by a factor