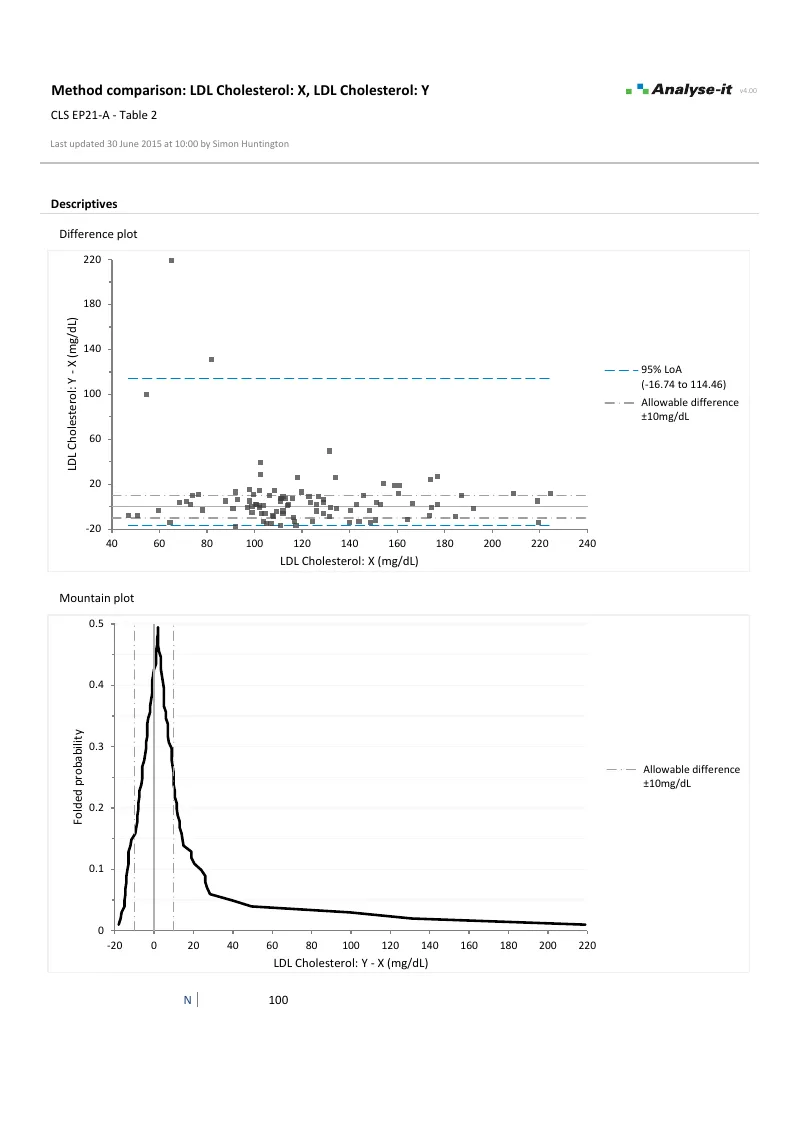
When you introduce a new analyser, switch reagent systems, or compare a point-of-care device against a laboratory method, you need to know whether the two methods agree well enough for clinical use. Correlation tells you the methods are related — it does not tell you they agree. A Bland–Altman difference plot shows you the bias between methods, how it varies across the measuring range, and where the limits of agreement fall relative to what is clinically acceptable.
The full Bland–Altman analysis. Mean and median bias with confidence intervals. Limits of agreement for constant precision and non-constant precision that widens across the range. Linear fit on the difference plot to detect concentration-dependent bias. Mountain plots as an alternative visualisation. Support for replicate measurements with proper within-subject variance estimation. Qualitative agreement with PPA/NPA and kappa for binary method comparisons.
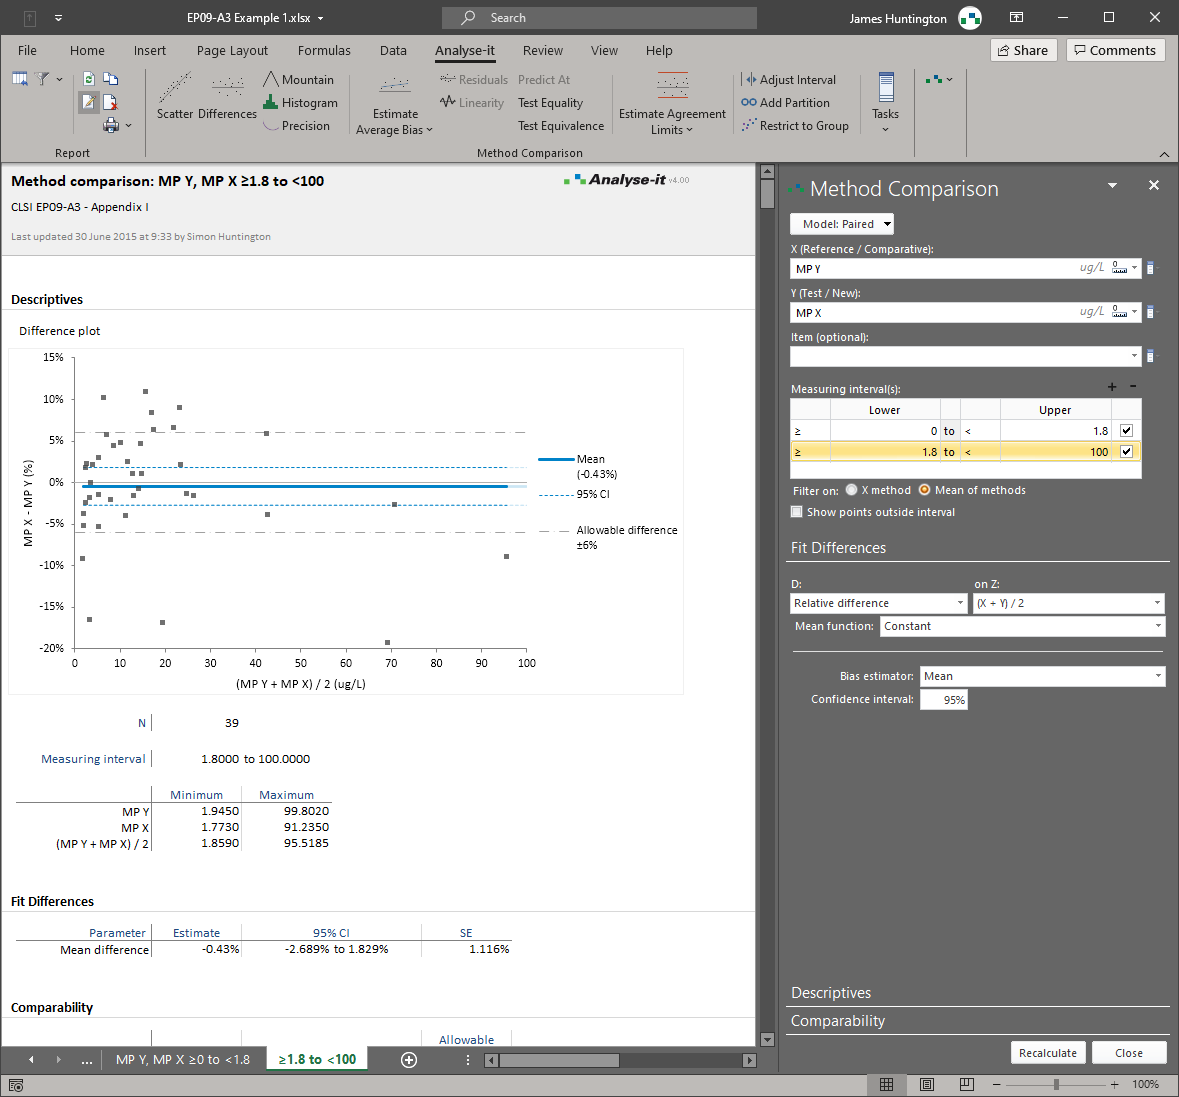
See Bland–Altman agreement results in detail — difference plots, limits of agreement, and mountain plots — using example datasets you can download and follow along with.
Bland–Altman agreement is one part of the Medical edition, alongside diagnostic accuracy, reference intervals, and survival analysis — plus the full Standard edition for hypothesis testing, regression, and descriptive statistics.
For formal method validation with Passing–Bablok, Deming regression, bias at clinical decision points, and CLSI protocol support, see the Method Validation edition.