Survival analysis software for clinical research
Kaplan–Meier survival curves with confidence bands, log-rank and weighted comparison tests, Cox proportional hazards regression with hazard ratios, restricted mean survival time, and diagnostic plots — time-to-event analysis alongside the full medical statistics toolkit in Excel.
Estimate survival, compare treatments, model risk
Clinical trials, cohort studies, and registry analyses all generate time-to-event data — time to death, recurrence, graft failure, hospital readmission. Censored observations are the norm, not the exception, so standard methods don’t apply. You need Kaplan–Meier estimation for the survival function, group comparison tests that handle censoring correctly, and Cox regression to model the effect of covariates on the hazard.
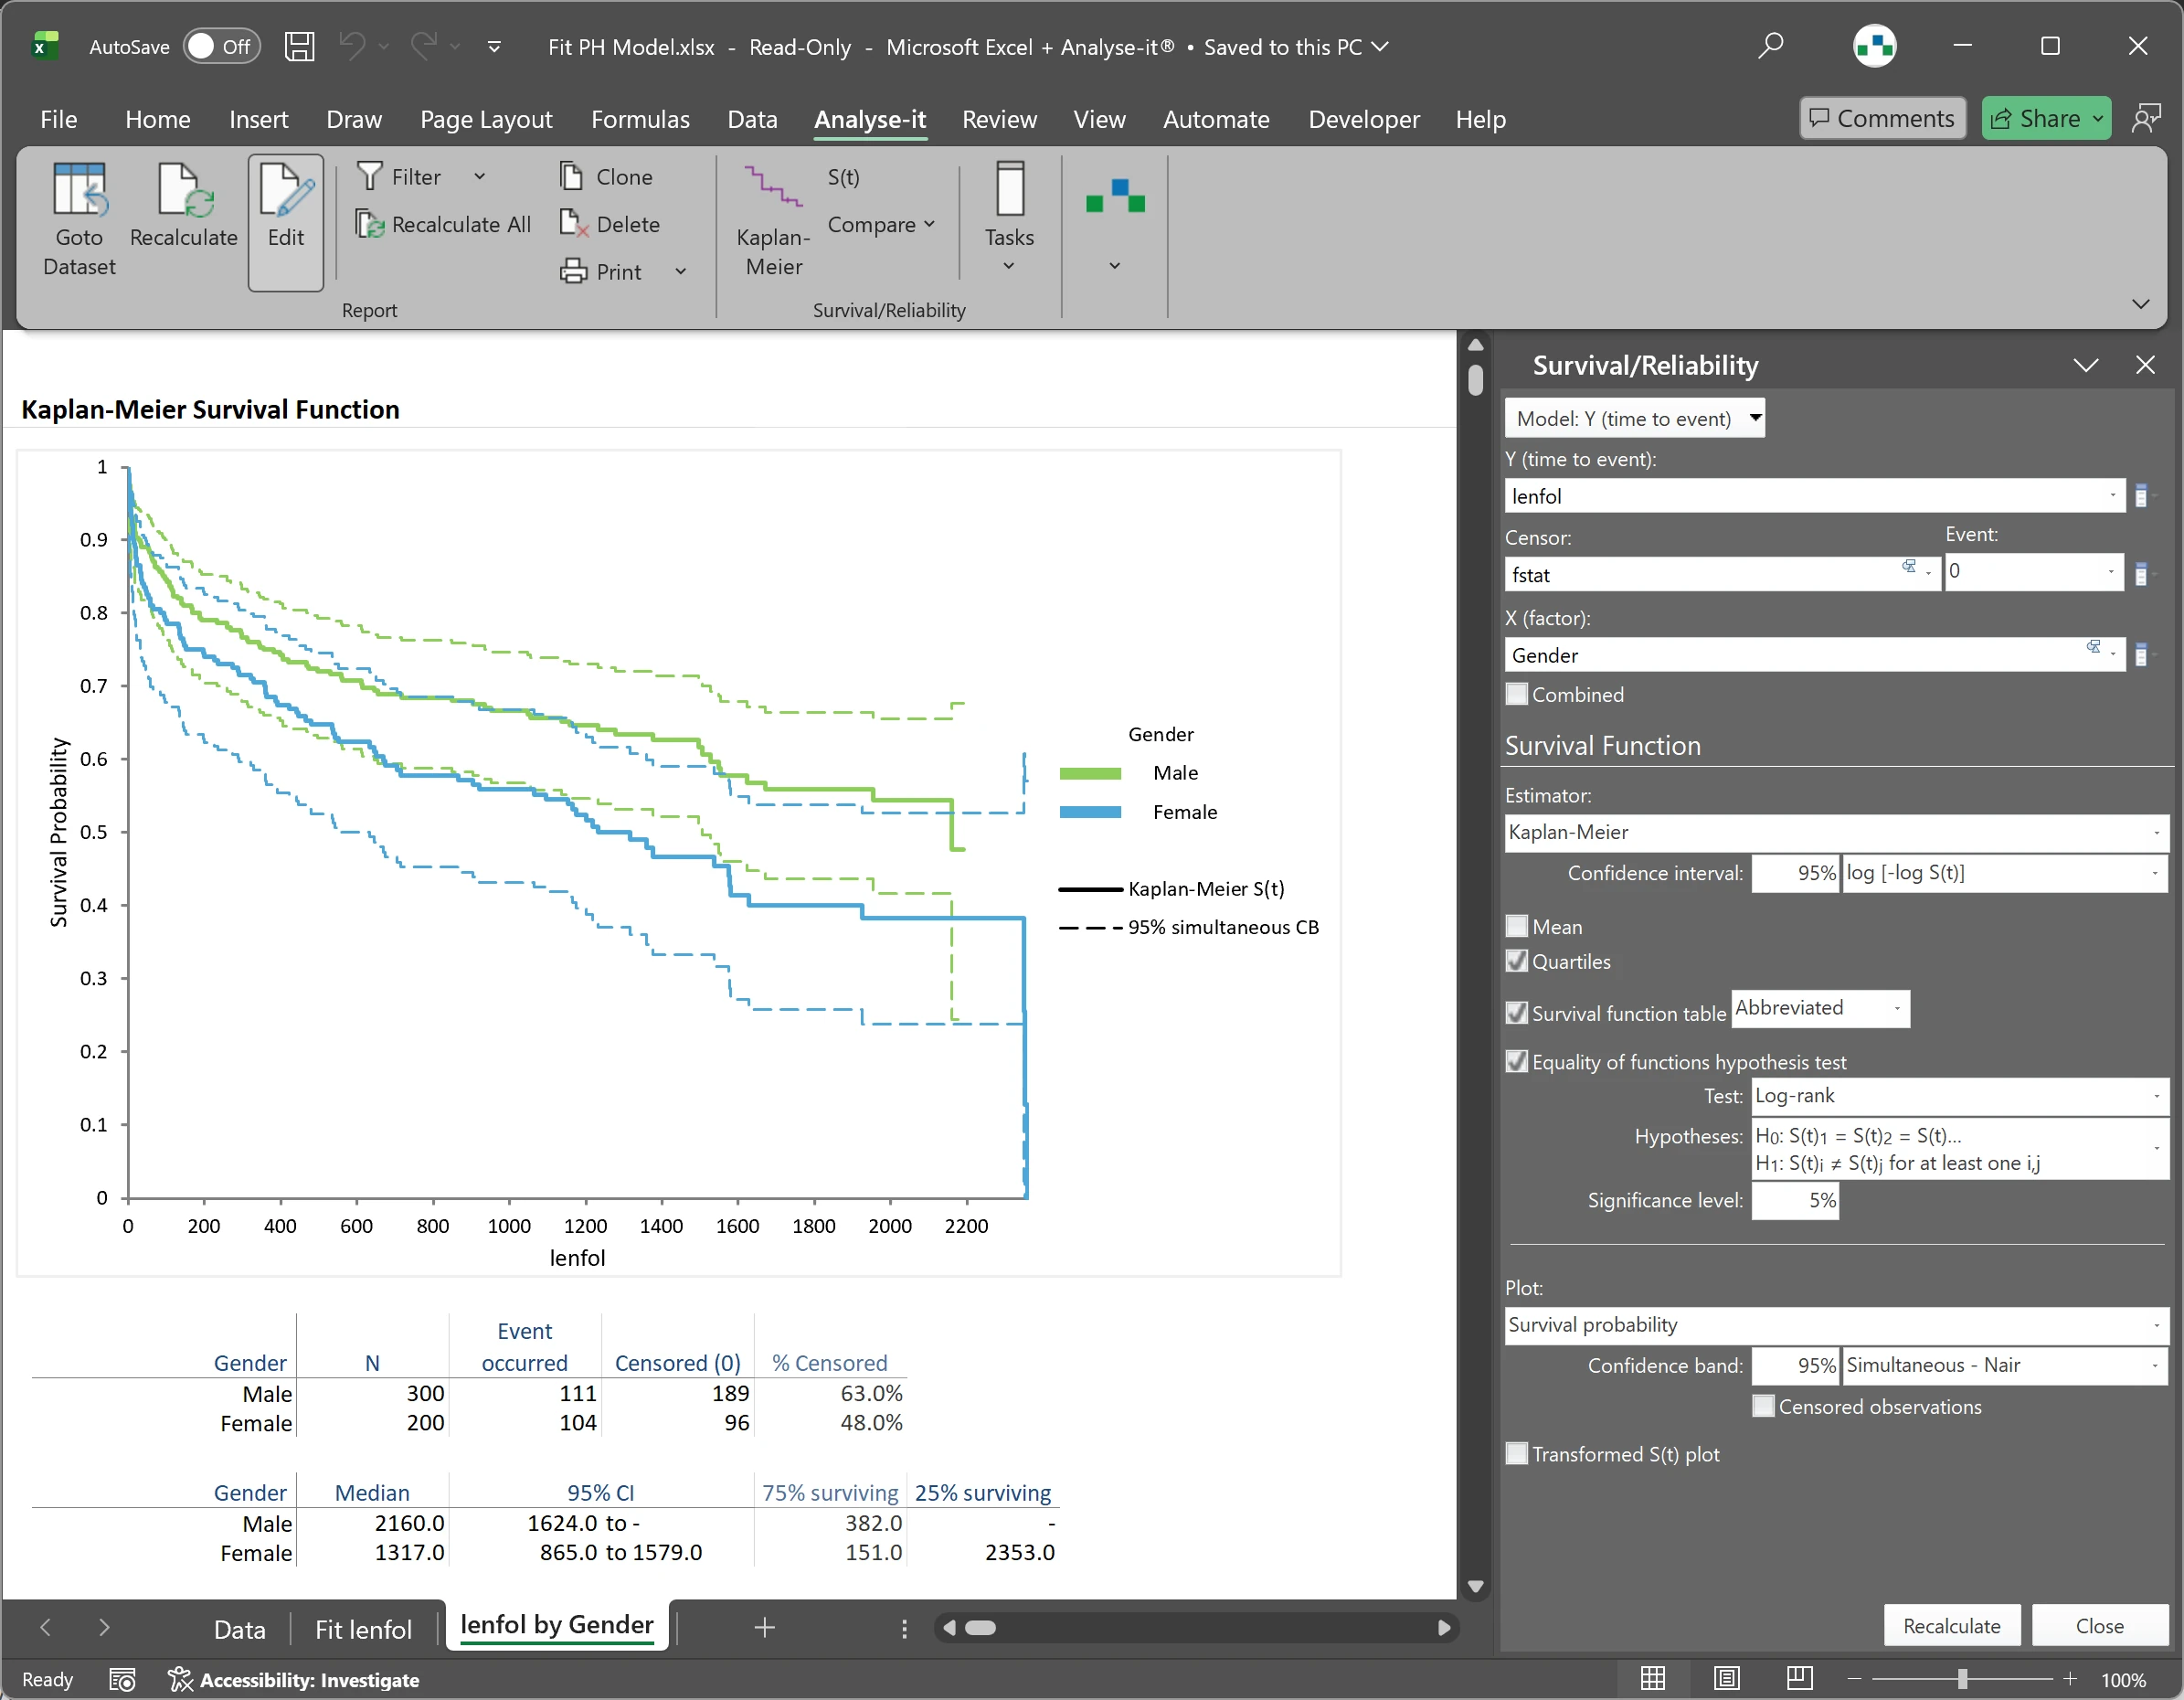
Three confidence band options for Kaplan–Meier curves, four group comparison tests with different weighting strategies, Cox proportional hazards with hazard ratios at specified covariate levels, and restricted mean survival time when the proportional hazards assumption is questionable. All inside Excel alongside the hypothesis tests, regression, and diagnostic accuracy analyses you need for the rest of the study.
Analyse-it has been a tremendous help. I’ve published and presented at national cardiology meetings and couldn’t have accomplished most of my research without it.
Addy Alsumidaie, MD, Ph.D.
Director, Clinical Development
Johnson and Johnson
What's included
Estimate the survival function with pointwise, Nair, and Hall–Wellner bands
Kaplan–Meier survival curve plot with pointwise, Nair (EP), and Hall–Wellner confidence bands. Median and quartile survival times with confidence intervals. Mean survival time as the area under the curve. Survival and failure probabilities at any time point you specify.
Test equality of survival functions with log-rank, Wilcoxon, and weighted tests
Log-rank, Wilcoxon (Breslow), Tarone–Ware, and Fleming–Harrington — four weighting strategies for different clinical questions. Log-rank weights equally across follow-up, Wilcoxon emphasises early differences, and the Fleming–Harrington family lets you specify the weight function. The choice of test can change the conclusion, so having all four available matters.
Model the effect of covariates with Cox proportional hazards regression
Parameter estimates with Wald confidence intervals. Hazard ratios at each level and at specified unit changes, including at specific levels of interacting covariates — such as the hazard ratio for treatment A vs B in patients over 65. Likelihood ratio and Wald tests for the overall model and individual terms. Baseline survival function and plot. Covariance of estimates.
Summarise average event-free time with restricted mean survival time
When the proportional hazards assumption doesn’t hold, or when you need a clinically interpretable summary measure that doesn’t depend on it, RMST gives you the average event-free time up to a specified time horizon. Increasingly used in clinical trial reporting as a complement or alternative to hazard ratios.
Assess the proportional hazards assumption with log–log diagnostic plots
Transformed log and log–log S(t) versus time plots for assessing the proportional hazards assumption. When the curves cross or diverge, consider stratification or reporting RMST instead of hazard ratios.
Example analyses
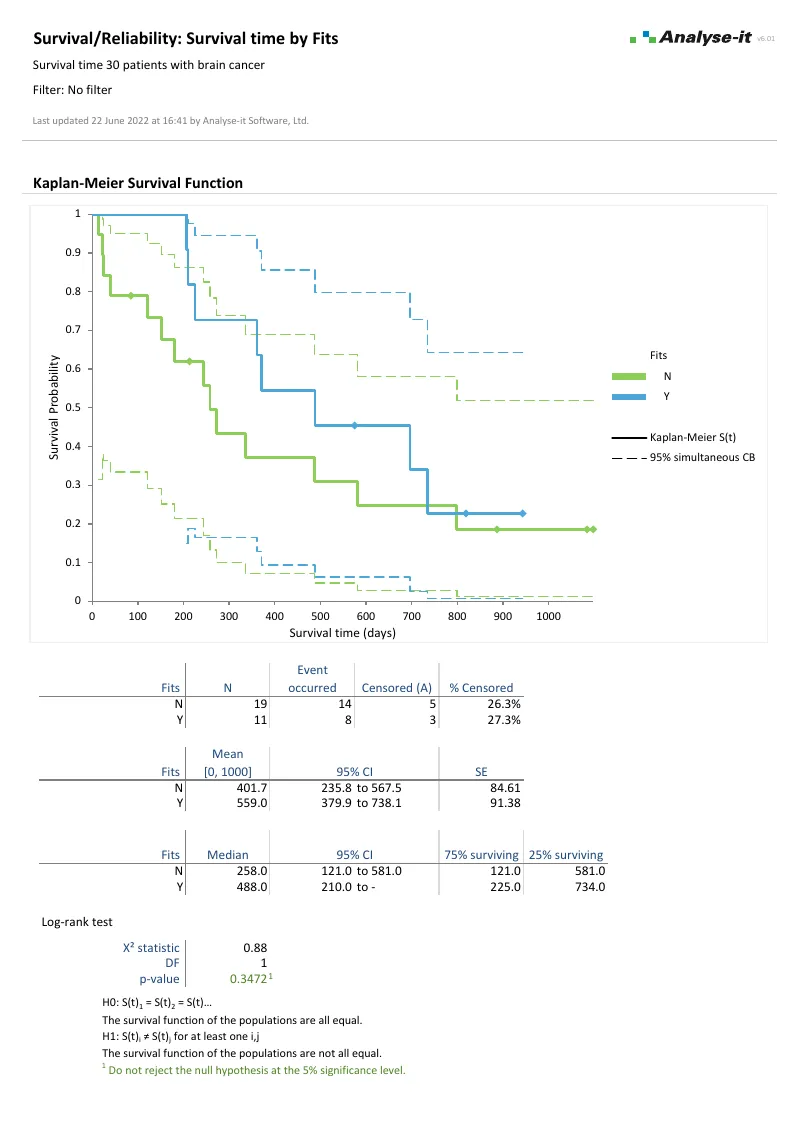
See survival analysis results in detail — Kaplan–Meier curves, group comparison tests, and Cox proportional hazards — using example datasets you can download and follow along with.
Kaplan–Meier survival analysis.
Two treatment groups. Kaplan–Meier curves with confidence bands. Log-rank test for equality. Median survival with CIs.
Software you can trust
Validated calculations you can defend at peer review
Every calculation is performed by Analyse-it — no Excel formulas, no third-party functions. Results are validated against published datasets and thousands of internal test cases before every release.
See how we develop and validate Analyse-it →
Patient data stays on your PC
Analyse-it runs entirely within Microsoft Excel on your PC. No cloud processing, no data transmission. Patient data and research data stay within your facility under your own data governance controls.
Standard Excel workbooks anyone can open
Every analysis is an ordinary .xlsx workbook. Share with co-authors, attach to a manuscript submission, archive for publication queries. No proprietary format, no licence required to view results. Co-authors and reviewers see exactly what you see.
Results that can’t be accidentally broken
Analysis output contains computed values, not formulas. Nothing to accidentally overwrite, no cell references to break, no formula errors to introduce. The results you published are exactly what you’ll find when you reopen the workbook months or years later when a reviewer asks.
Technical details
Survival function new in v6.10
- Kaplan–Meier survival curve plot with pointwise, Nair, or Hall–Wellner confidence bands
- Median and quartiles for survival/failure
- Mean (area under survival curve) and restricted mean
- Survival/failure probabilities and confidence intervals
- Test equality of survival functions with log-rank, Wilcoxon, Tarone–Ware, Fleming–Harrington
- Transformed log and log–log S(t) vs time plots
Proportional hazards new in v6.10
- Model equation
- Parameter estimates and Wald confidence intervals
- Covariance of estimates
- Baseline survival function and plot
- Likelihood ratio and Wald test of model and terms
- Hazard ratio and Wald Z CI at each level / specified unit change and at specific levels of interacting covariates