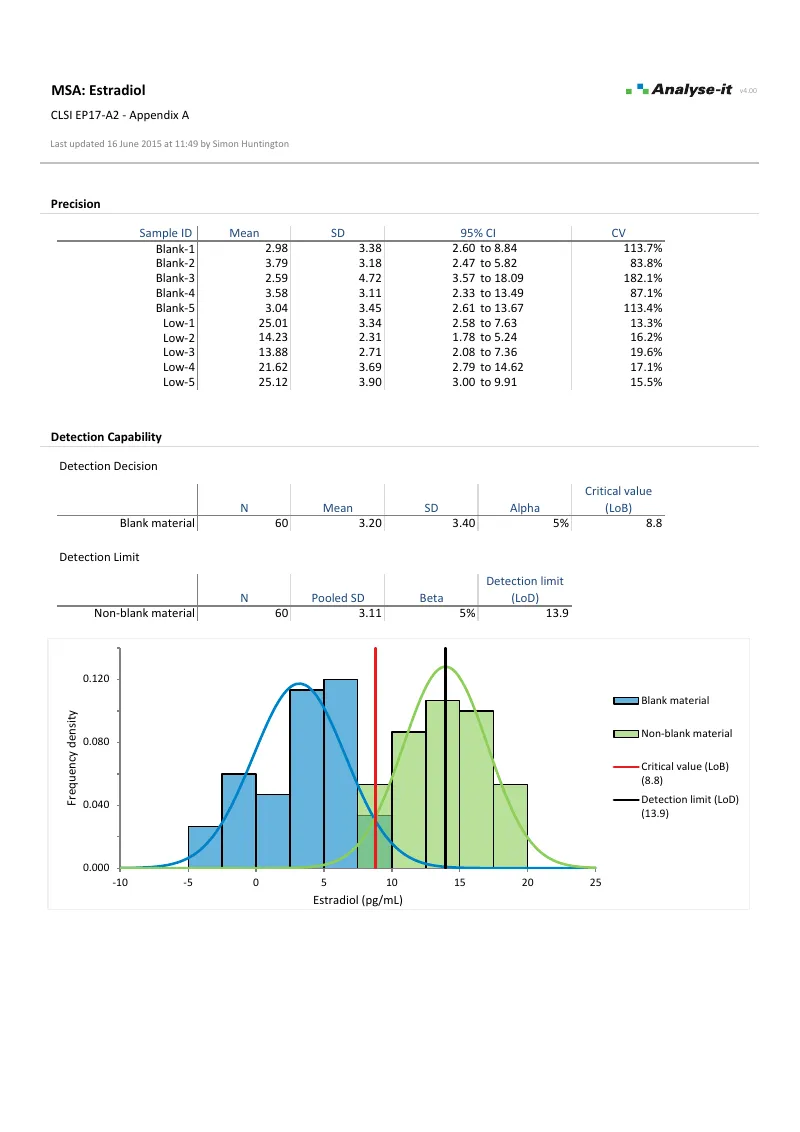
Low-concentration results drive clinical decisions — ruling out disease, screening, monitoring drug levels. If the measurement procedure can’t reliably distinguish a true signal from blank noise, you risk reporting false positives or missing genuine low-level results. Getting detection limits wrong means either under-reporting (clinically dangerous) or over-reporting (eroding trust in the assay). EP17-A2 defines the framework: LoB characterises the noise floor, LoD confirms the lowest concentration you can reliably detect, and LoQ determines where measurement uncertainty is small enough for the result to be clinically actionable.
Analyse-it covers the full EP17-A2 workflow with multiple estimation approaches for each limit. Precision profiles from EP05-A3 studies feed directly into the variance function methods — no re-entering data, no separate tools for LoB, LoD, and LoQ.

See detection capability results in detail — LoB, LoD, probit regression, and LoQ — using CLSI example datasets you can download and follow along with.
 EP17-A2 — Appendix A
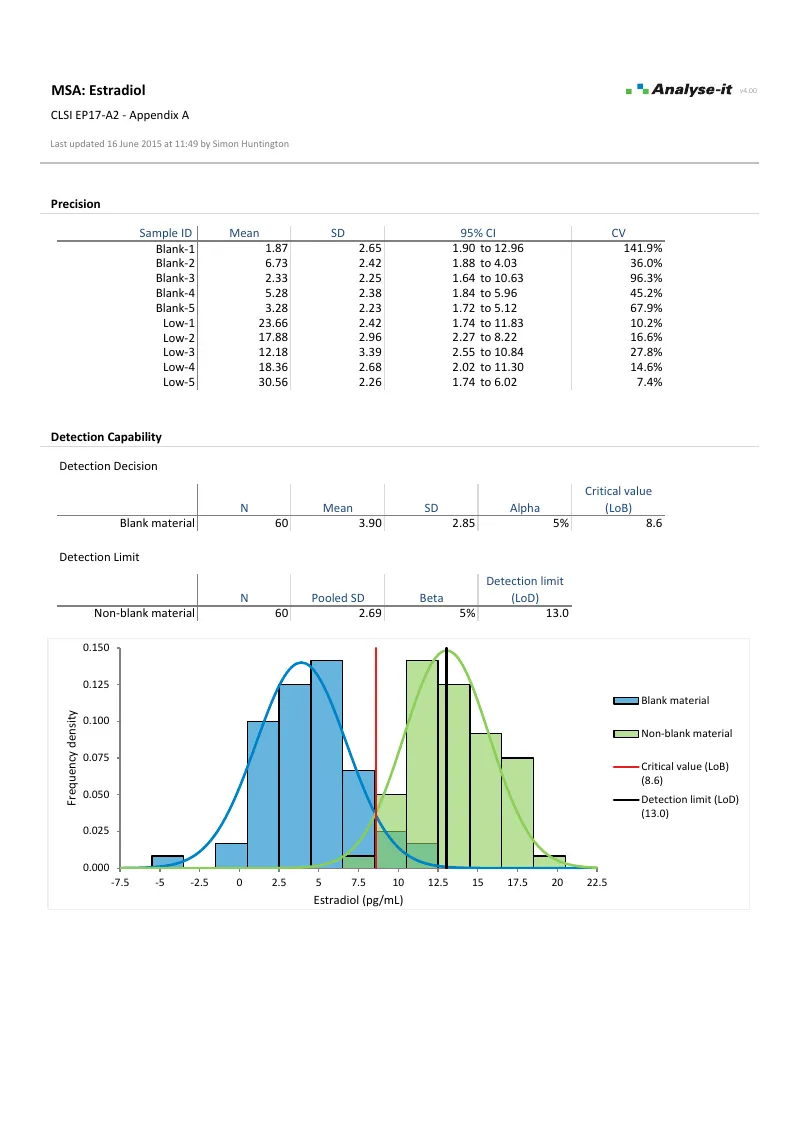 EP17-A2 — Appendix A
Detection capability is one part of measurement system analysis, alongside precision (EP05-A3), linearity (EP06-A), bias/trueness verification (EP15-A3), and interference evaluation (EP10-A3-AMD). Precision profiles from EP05-A3 feed directly into detection capability estimation.
See the full MSA workflow on the measurement system analysis page →