Linearity evaluation software for method validation
Polynomial regression with nonlinearity testing per EP06-A — weighted models, adjustable measuring intervals, and formal equivalence testing to determine the reportable range.
Determine where the assay is linear — and where it isn’t
A measurement procedure that’s nonlinear beyond acceptable limits means results outside the reportable range can’t be trusted. EP06-A provides the framework for fitting polynomial models, quantifying the deviation from linearity, and testing whether it falls within allowable limits. IVD manufacturers need this to define the reportable interval for product labelling; clinical laboratories need it to verify the manufacturer’s claimed range on their own instrument.
I used Analyse-It for many product development, product troubleshooting, and technology evaluation activities... your product was the easiest to use, was accurate, and produced publication ready reports.
Stanley F. Cernosek, Ph.D.
Clinical Chemistry Reagent Development
Beckman Coulter, Inc.
Analyse-it fits polynomial models up to 5th order with forward stepwise selection, weighted models for non-constant precision, and formal nonlinearity testing against an allowable goal using Hsieh-Liu confidence intervals. Adjust the measuring interval to find the linear range, and run equality or equivalence tests to demonstrate linearity is within limits. The difference plot shows exactly where and by how much the deviation occurs.
What's included
Determine where the assay is linear and where it deviates
Polynomial models up to 5th order with forward stepwise and best-fit selection. Difference plot shows exactly where deviation from linearity occurs and by how much.
Test whether nonlinearity is within acceptable limits
Formal nonlinearity test with Hsieh-Liu confidence intervals. Equality and equivalence tests against an allowable nonlinearity goal. Difference plot with allowable nonlinearity band.
Define or verify the reportable range
Adjust the measuring interval to find the linear range. Determine where to restrict reporting when the full range is non-linear.
Handle precision that varies across the range
Weighted models for non-constant precision across the measuring interval.
Emancipator-Kroll linearity
Alternative linearity assessment method also supported.
Example analyses
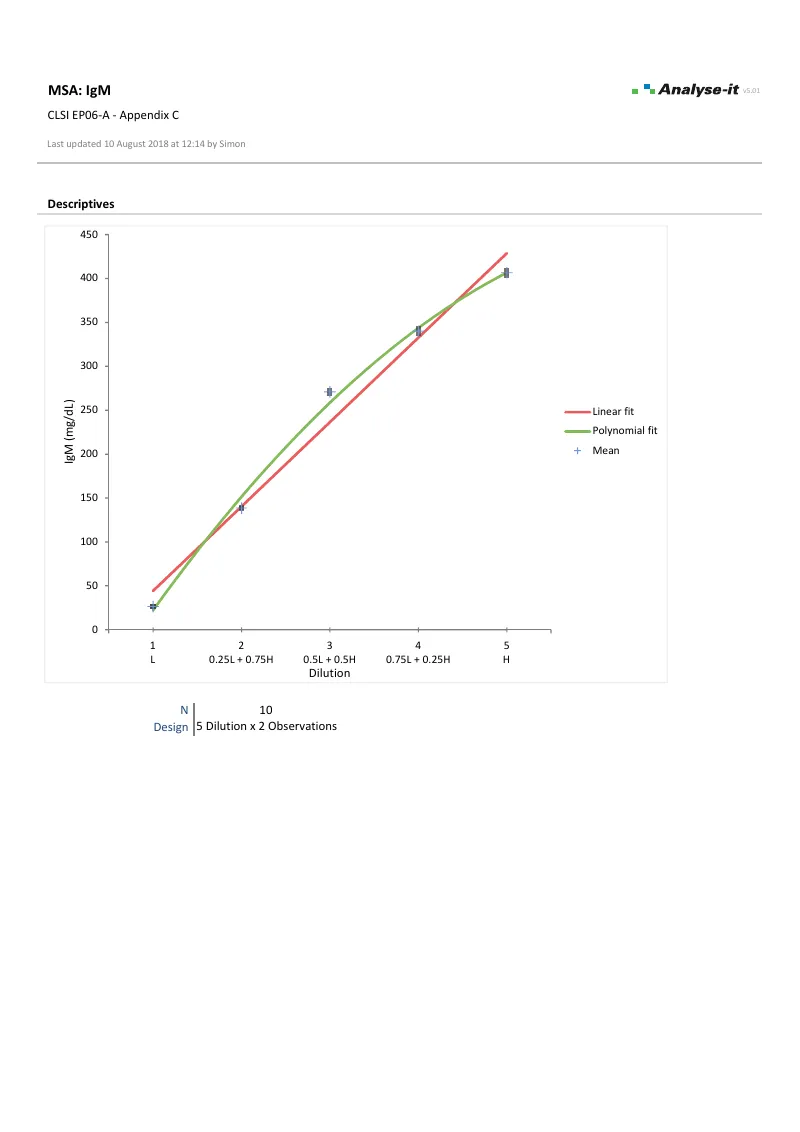
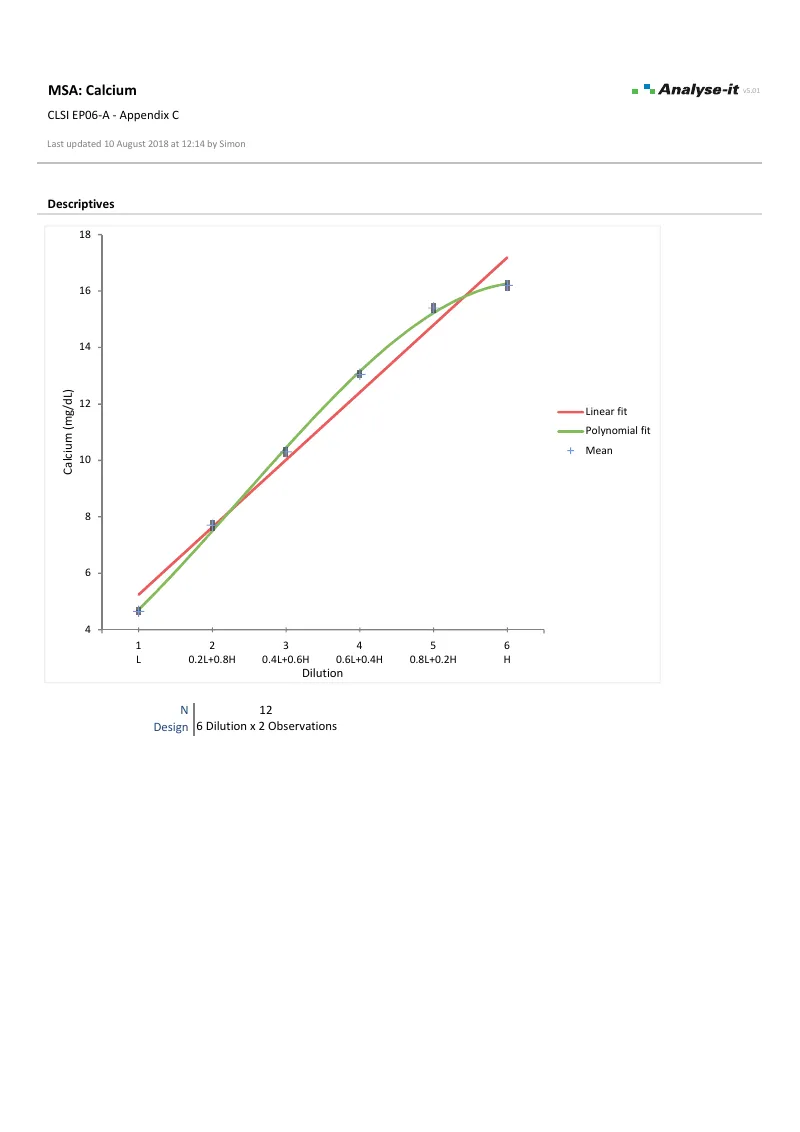
See linearity evaluation results in detail — polynomial fits, difference plots, and nonlinearity testing — using CLSI example datasets you can download and follow along with.
EP06-A — Appendix C
IgM linearity evaluation.
5 dilutions × 2 observations. Linear and 2nd order polynomial fits. Difference plot with ±5% allowable nonlinearity band.
EP06-A — Appendix C
Calcium linearity evaluation.
6 dilutions × 2 observations. Linear and 3rd order polynomial fits with difference plot and allowable nonlinearity band.
Validated, reliable, trusted for over 30-years
Validated calculations you can defend at inspection
Every calculation by Analyse-it, no Excel formulas, and no third-party functions. Validated against CLSI reference datasets, published datasets, and thousands of internal test cases. Defensible in a 510(k), CE-IVD technical file, CAP inspection, or ISO 15189 audit. See how we
develop and validate Analyse-it →
Data stays in your facility
Analyse-it runs entirely within Excel on your PC. No cloud processing, no data transmission.
Your pre-submission and patient-adjacent data stays within your facility under your data governance controls.
Standard Excel workbooks
Analyses are ordinary Excel workbooks that you can share with colleagues, archive for audit, and open on any machine with Excel — no Analyse-it licence required.
No formulas to break
Results contain no formulas, so they can’t be accidentally edited or corrupted. The results you reported will be exactly what you find when you reopen the workbook.
Technical details
CLSI protocols
- EP06-A: Evaluation of the Linearity of Quantitative Measurement Procedures
Regression models
- Linear
- Polynomial (2nd to 5th order)
- Forward stepwise polynomial
- Best (2nd or 3rd) polynomial
- Weighted models for non-constant precision new in v5.00
Nonlinearity testing
- Difference between linear and nonlinear fit
- Hsieh-Liu confidence intervals
- Equality test (no nonlinearity)
- Equivalence test (nonlinearity within allowable limit)
- Emancipator-Kroll linearity
Measuring interval
- Adjustable measuring interval to find linear range new in v5.00
Plots
- Linearity plot with linear and polynomial fits
- Difference plot with allowable nonlinearity band