Before a measurement procedure goes into clinical use, you need to know how precise it is, how accurate, whether it’s linear across the reportable range, how susceptible it is to common interferents, and the lowest concentration it can reliably detect. Each characteristic has its own CLSI protocol, its own experimental design, and its own acceptance criteria. Doing this work in separate tools means re-entering data, reconciling formats, and risking errors at every handoff — especially problematic when the results feed into a 510(k) submission or accreditation file.
Analyse-it unifies all five protocols in one analysis. Design the experiment with flexible nested factors, run precision, trueness, linearity, interferences, and detection capability, and let precision profiles feed directly into LoB, LoD, and LoQ estimation — no re-entering data, no separate tools.


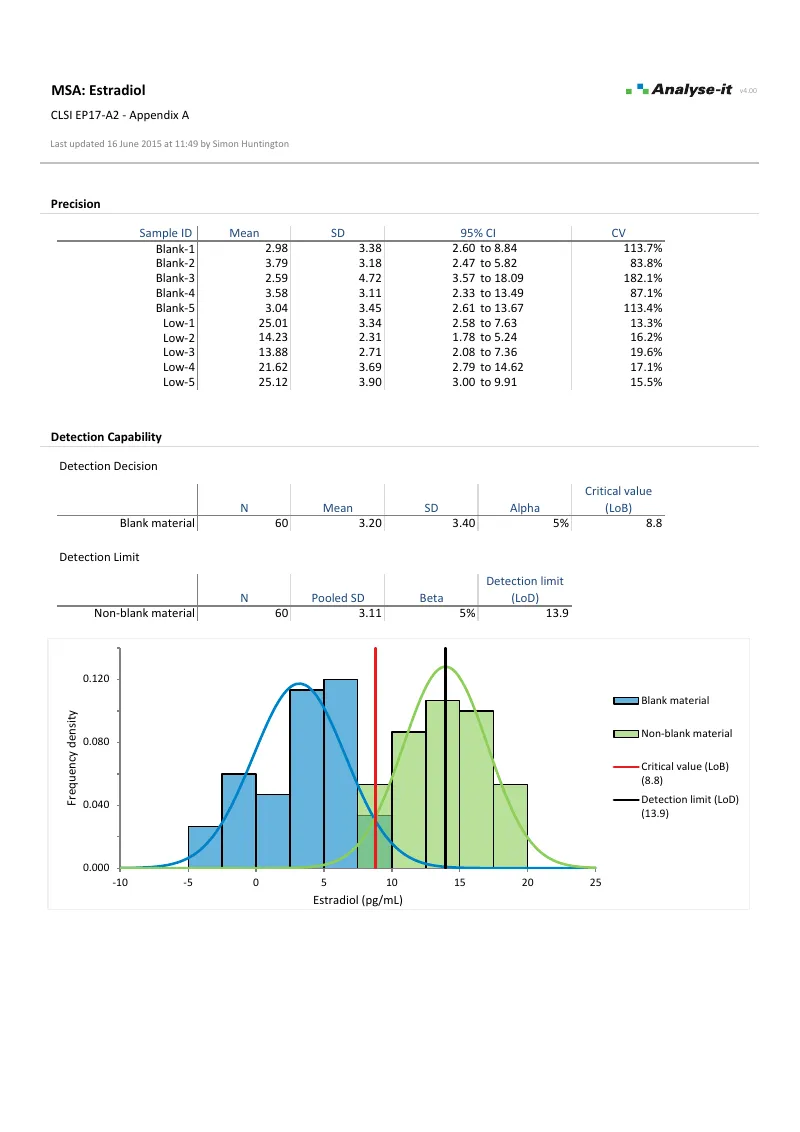
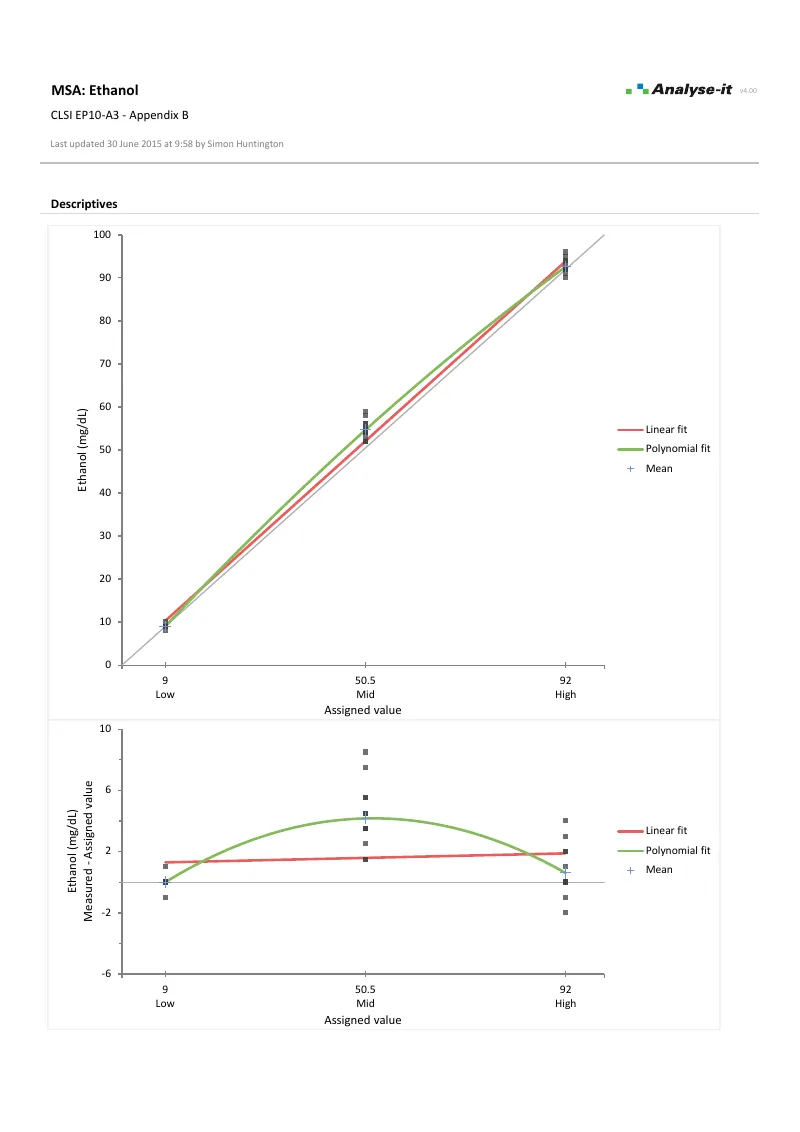
See measurement system analysis results in detail — precision, trueness, linearity, interferences, and detection capability — using CLSI example datasets you can download and follow along with.
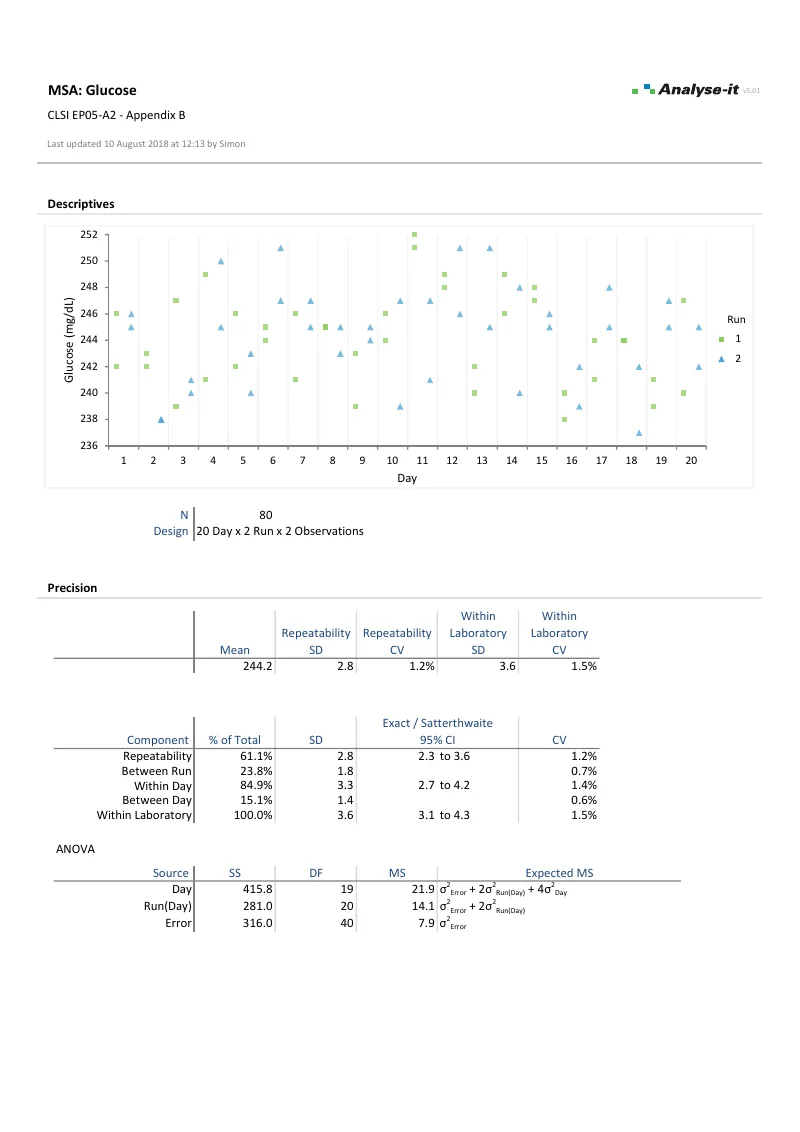 EP05-A3 — Appendix B
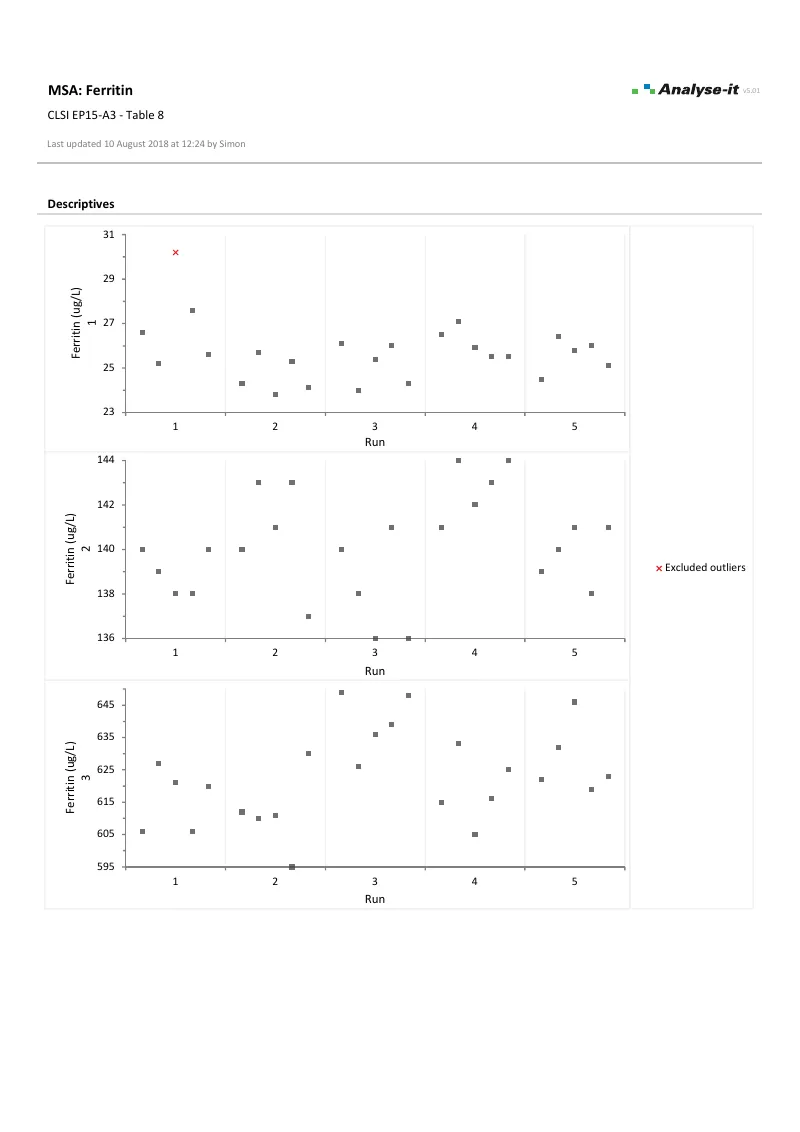 EP15-A3 — Table 8
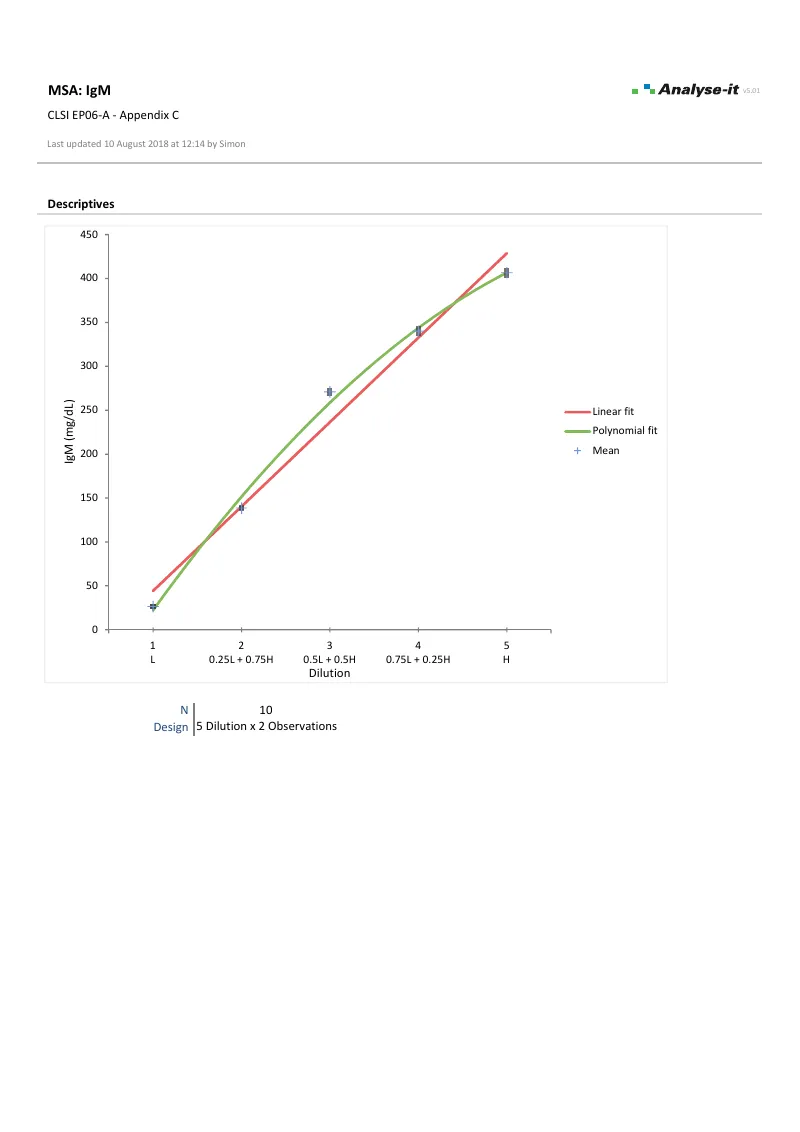 EP06-A — Appendix C
Measurement system analysis is one part of the Method Validation Edition, alongside method comparison, reference intervals, and diagnostic performance.