Diagnostic performance and ROC curve software for method validation ROC curve analysis per EP24-A2 and qualitative test evaluation per EP12-A2 — AUC comparison, optimal threshold determination, and diagnostic accuracy metrics.

Establish the diagnostic accuracy of your test

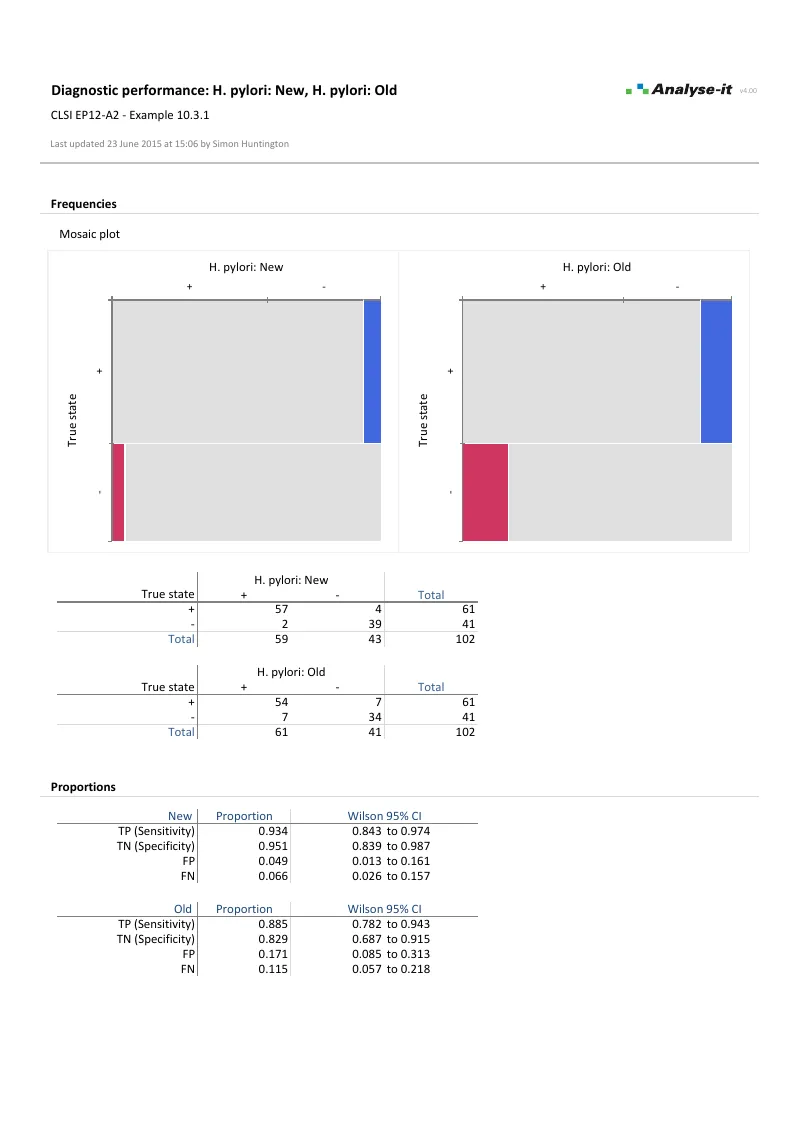
A measurement procedure can be precise, linear, and well-characterised analytically — and still be clinically useless if it can’t reliably distinguish positive from negative cases. Diagnostic performance evaluation answers the question that matters most: how well does the test actually discriminate? Set the threshold too low and you flood clinicians with false positives. Set it too high and you miss disease. The trade-off between sensitivity and specificity depends on the clinical context, and the optimal threshold depends on who you’re testing and what the consequences of misdiagnosis are.

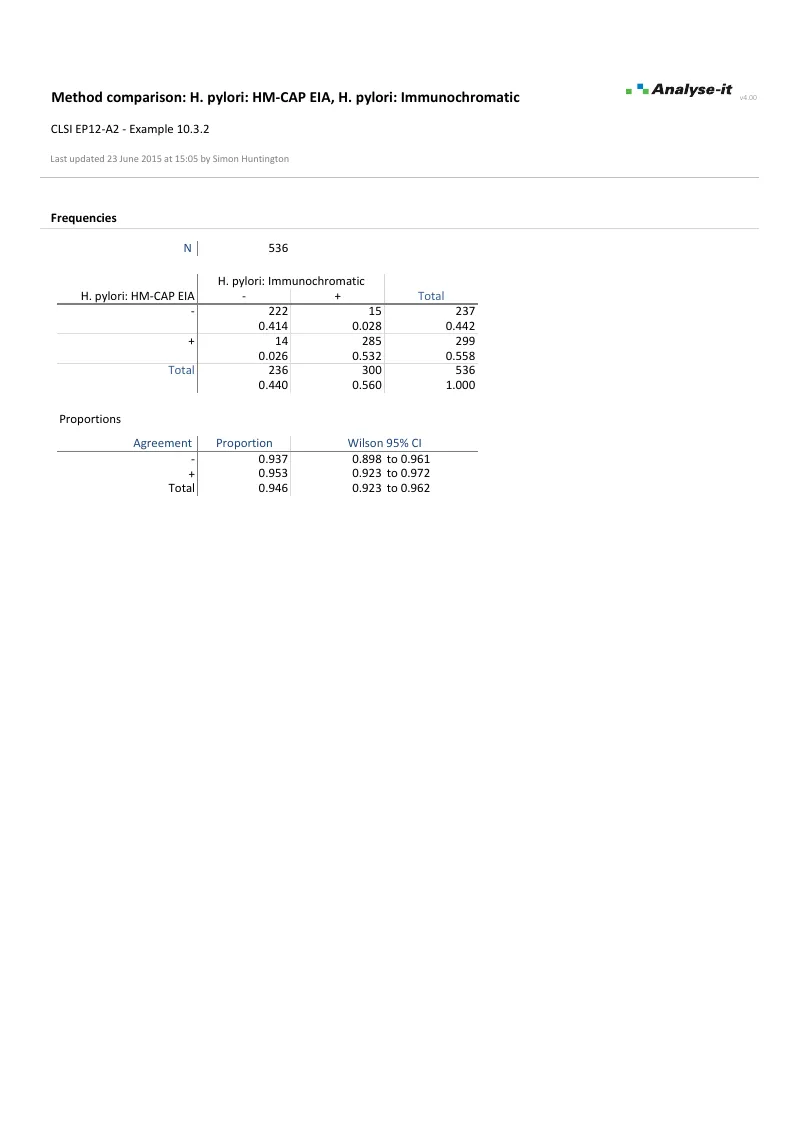
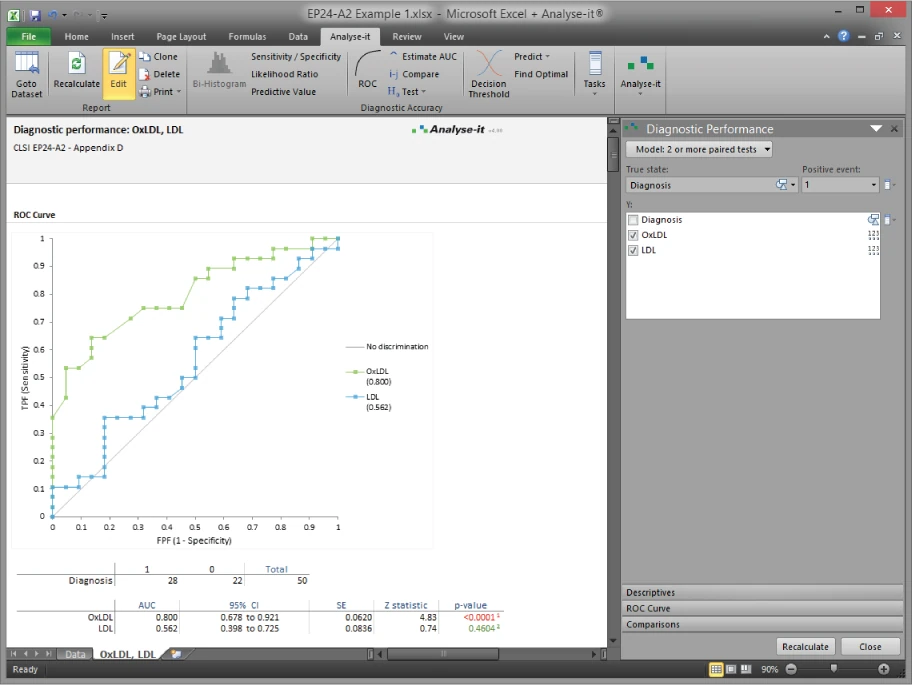
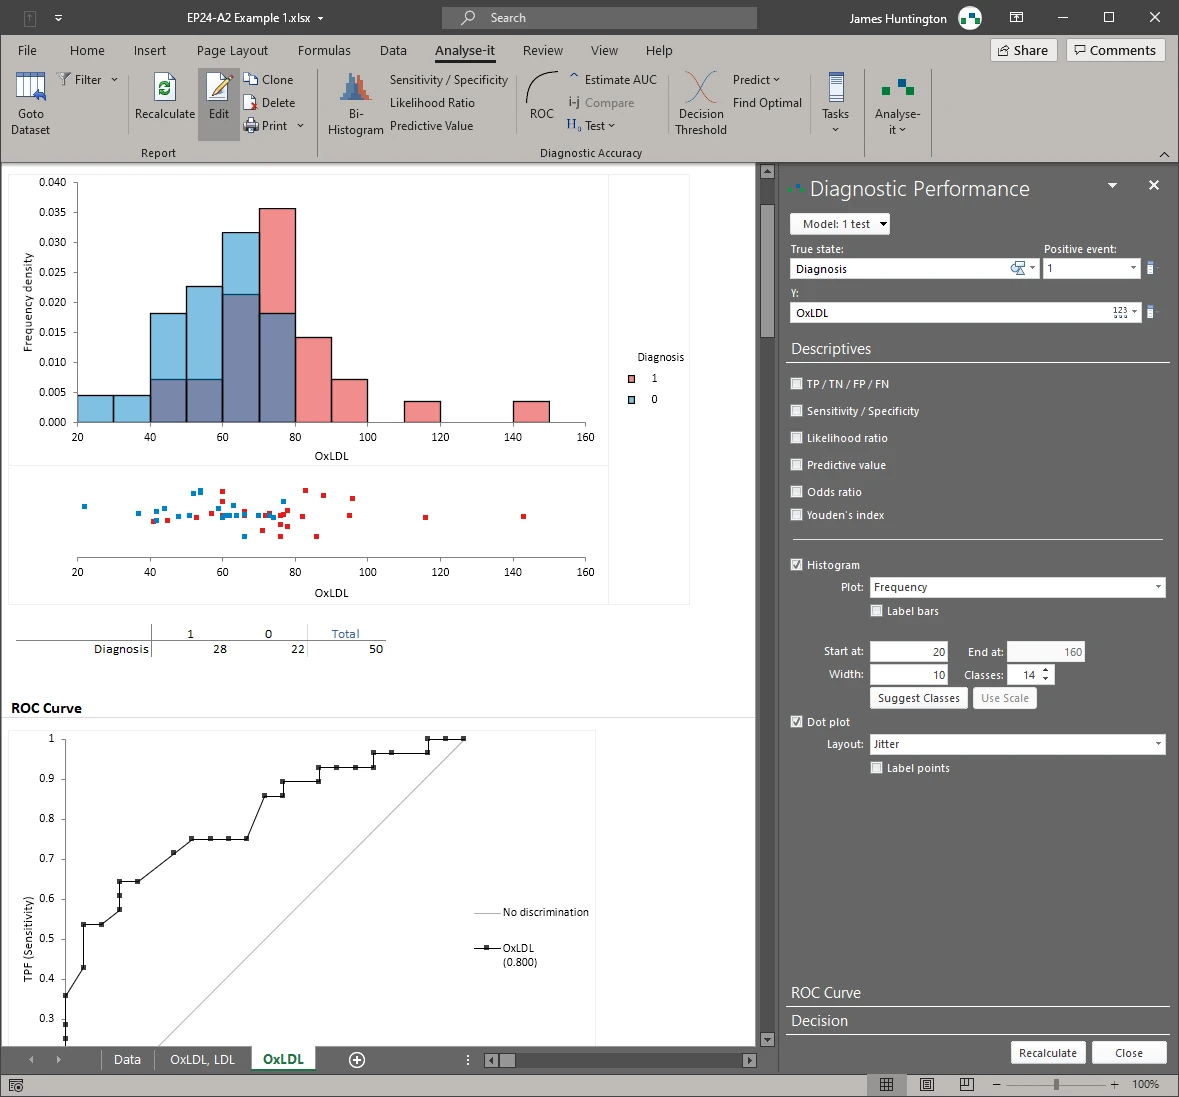
Analyse-it covers both quantitative tests (EP24-A2 ROC analysis with DeLong AUC comparison) and qualitative tests (EP12-A2). Compare up to 10 tests simultaneously, determine optimal thresholds, and produce the diagnostic accuracy evidence for product labelling, regulatory submissions, or publication.

Analyse-it has been a tremendous help. I’ve published and presented at national cardiology meetings and couldn’t have accomplished most of my research without it. Using Analyse-it, I even found errors or omissions in the work of our statistician!
Regina S. Druz, MD, FACC, FASNC
Director, Nuclear Cardiology
North Shore University Hospital

What's included

ROC curves with AUC and DeLong confidence intervals

Empirical and binormal ROC curves for 1 test, up to 10 paired tests, or up to 10 independent tests. AUC with DeLong confidence intervals. Z test of AUC better than chance. Predict sensitivity at a fixed false positive fraction, or vice versa.

Compare up to 10 tests head-to-head

DeLong test for the difference in AUC between paired or independent tests, with equality, equivalence, and non-inferiority options — such as testing whether a new biomarker’s AUC is within 0.05 of the established assay. All tests plotted on the same ROC chart for visual comparison.

Optimal decision threshold

Decision plot showing sensitivity, specificity, likelihood ratios, predictive values, or cost across all possible thresholds. Optimal threshold by Youden index, closest-to-(0,1) on the ROC curve, or minimum cost when false positives and false negatives carry different clinical consequences. Bi-histogram of positive and negative outcomes shows the overlap between populations.

Diagnostic accuracy metrics with confidence intervals

Sensitivity, specificity, positive and negative predictive values, positive and negative likelihood ratios, diagnostic odds ratio, and Youden’s index — each with confidence intervals. Dot plot of positive and negative cases.

Qualitative test evaluation per EP12-A2

Sensitivity and specificity with Clopper-Pearson exact or Wilson score CIs. Proportion in positive and negative agreement between paired methods. Difference in sensitivity/specificity with Newcombe CIs and Score Z test. Kappa and weighted kappa for chance-corrected agreement. Mosaic plot of outcomes.

Example analyses

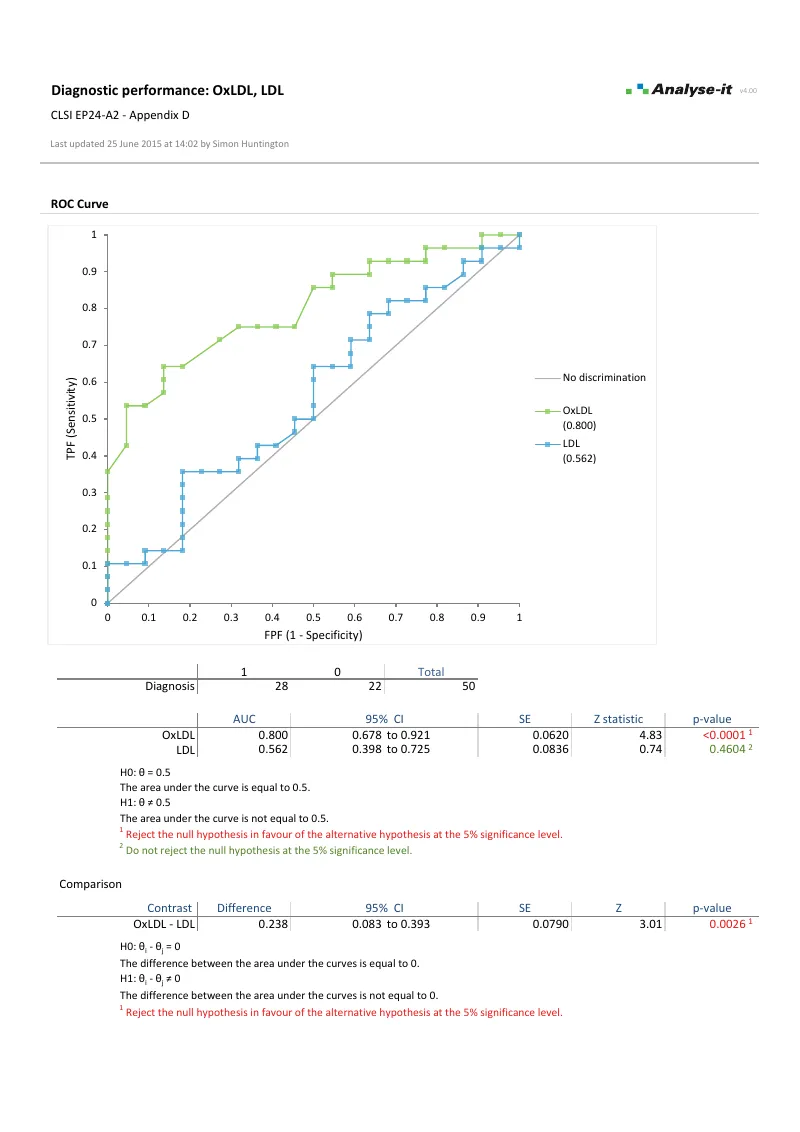
See diagnostic performance results in detail — ROC curves, AUC comparison, threshold determination, and qualitative test evaluation — using CLSI example datasets you can download and follow along with.

EP24-A2 — Appendix D
OxLDL and LDL diagnostic accuracy.
Two paired tests. ROC curves, AUC with DeLong CIs. DeLong comparison of AUC between tests. Bi-histogram and decision plot.
EP12-A2 — Example 10.3.1
H. pylori qualitative test evaluation.
Two paired tests against true state. Sensitivity, specificity, predictive values with Wilson CIs. Difference with Newcombe CIs and Score Z test. Mosaic plots.
EP12-A2 — Example 10.3.2
H. pylori method comparison.
HM-CAP EIA vs Immunochromatic. Proportion in positive and negative agreement with Wilson CIs.

Part of the Method Validation Edition

Diagnostic performance is one part of the Method Validation Edition, alongside measurement system analysis, method comparison, and reference intervals.

Software you can trust

Validated calculations you can defend at inspection Every calculation is performed by Analyse-it — no Excel formulas, no third-party functions. Results are validated against CLSI reference datasets, published datasets, and thousands of internal test cases before every release. See how we develop and validate Analyse-it →
Data stays in your facility Analyse-it runs entirely within Microsoft Excel on your PC. No cloud processing, no data transmission. Pre-submission data, patient-adjacent data, and in-process results stay within your facility under your own data governance controls.
Standard Excel workbooks anyone can open Every analysis is an ordinary .xlsx workbook. Share with colleagues, submit to regulatory affairs, archive for audit, open on any PC with Excel. No proprietary format, no licence required to view results. Colleagues and auditors see exactly what you see.
Results that can’t be accidentally broken Analysis output contains computed values, not formulas. Nothing to accidentally overwrite, no cell references to break, no formula errors to introduce. The results you reported are exactly what you’ll find when you reopen the workbook months or years later for an audit.

Technical details

CLSI protocols

  • EP24-A2: Assessment of the Diagnostic Accuracy of Laboratory Tests Using Receiver Operating Characteristic Curves
  • EP12-A2: User Protocol for Evaluation of Qualitative Test Performance

ROC (quantitative)

  • 1 test, up to 10 paired tests, or up to 10 independent tests/groups
  • AUC with DeLong CIs
  • Z test of AUC better than chance
  • DeLong difference in AUC: equality, equivalence, non-inferiority
  • Predict FPF at fixed sensitivity, sensitivity at fixed FPF, or both at fixed threshold

Threshold determination

  • Decision plot: sensitivity vs specificity, likelihood ratios, predictive values, or cost
  • Optimal threshold by Youden index or cost of diagnosis/misdiagnosis

Accuracy metrics (ROC)

  • Sensitivity / specificity
  • Likelihood ratios
  • Predictive values
  • Odds ratio
  • Youden’s index
  • TP, TN, FP, FN counts

Qualitative (EP12-A2)

  • 1 test, 2 paired tests, or 2 independent tests/groups
  • Sensitivity/specificity (Clopper-Pearson exact, Wilson score CIs)
  • Likelihood ratios (Miettinen-Nurminen score CIs)
  • Predictive values (Mercado-Wald logit CIs)
  • Difference in sensitivity/specificity (Newcombe, Tango score CIs)
  • McNemar-Mosteller exact, Fisher exact, Score Z test

Plots

  • ROC curve with no-discrimination line
  • Decision plot
  • Bi-histogram of positive/negative outcomes new in v4.00
  • Dot-plot of positive/negative outcomes new in v4.00
  • Mosaic plot (qualitative)