ANOVA and ANCOVA software for group comparisons One-way, two-way, and multi-factor ANOVA and ANCOVA — with nine multiple comparison procedures, interaction plots, leverage plots, residual diagnostics, and Welch's ANOVA for unequal variances. NIST-validated calculations.
Trusted by 75,000 researchers, analysts, and scientists at leading universities, hospitals, and companies worldwide — for over 30 years.
Beyond the one-way case
One-way, two-way, and full multi-factor ANOVA and ANCOVA in the same workflow — crossed factors, polynomial terms, interactions, and continuous covariates. Full factorial and custom model structures with Type I and Type III tests for each term.
Nine multiple comparison procedures
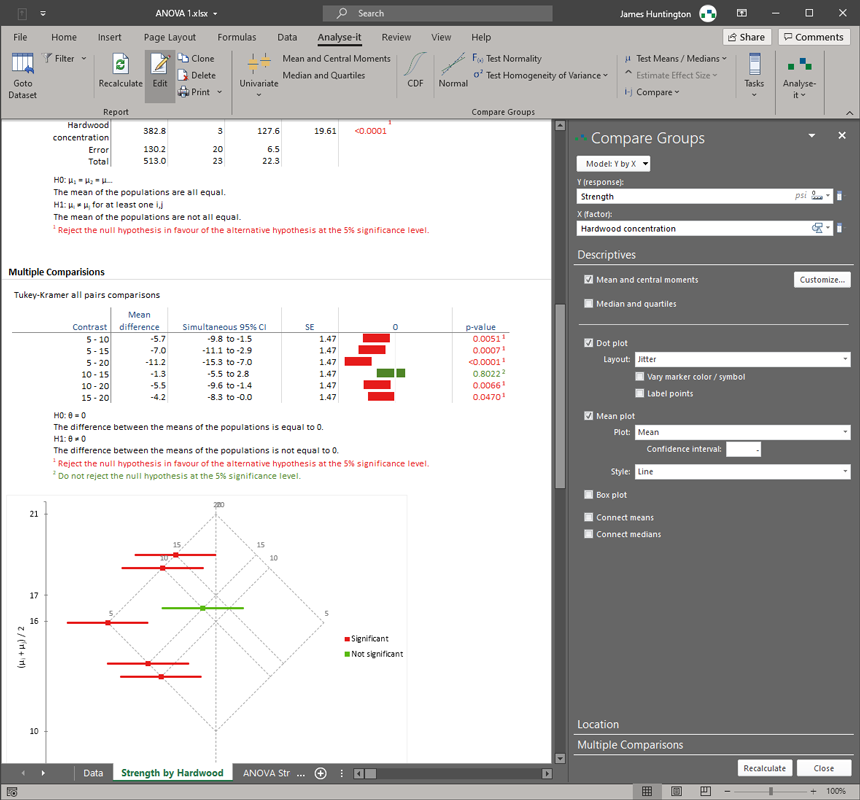
Tukey-Kramer and Dwass-Steel-Critchlow-Fligner for all pairs. Dunnett and Steel against a control. Hsu with the best. Scheffe for all contrasts. Student's t and Wilcoxon-Mann-Whitney for individual comparisons. The right procedure for the specific question your analysis requires.
NIST-validated accuracy
All calculations run in Analyse-it's own validated engine — not Excel's built-in functions. Validated against NIST Standard Reference Datasets with IEEE 754 double-precision arithmetic throughout.
Excel's built-in ANOVA tool handles the simple one-way case, produces a static output table, and stops there. No interaction plots. No multiple comparisons. No way to include covariates or build multi-factor models. No way to check whether the assumptions hold. For anything beyond the simplest design, it is not a viable tool — and the results it does produce cannot be iterated or updated when the data changes.
Analyse-it provides a complete ANOVA workflow. Build one-way and multi-factor models with crossed factors, polynomial terms, interactions, and continuous covariates. Test for homogeneity of variances with Bartlett, Levene, and Brown-Forsythe before committing to a model. Examine main effects and interactions visually with effect mean plots and interaction plots. Use leverage plots to assess the contribution of each term after accounting for all others. When the residuals suggest a problem — non-normality, heteroscedasticity, influential observations — adjust the model and re-run immediately. Everything updates in the same workbook.
Knowing that groups differ is only the start. The nine multiple comparison procedures answer the specific question the analysis requires. Tukey-Kramer for all pairwise comparisons. Dunnett for comparisons against a control. Hsu for comparisons with the best. Scheffe for arbitrary contrasts. Dwass-Steel-Critchlow-Fligner and Steel as non-parametric alternatives. Each procedure controls the family-wise error rate appropriately for its comparison structure. For designs with a continuous covariate, ANCOVA adjusts for the covariate, examines adjusted effect means, and runs the same multiple comparison procedures on the corrected estimates.
75,000 researchers, analysts, and scientists at leading universities, hospitals, and companies worldwide have relied on Analyse-it for over 30 years.
What's included
-
Compare groups with one-way ANOVA
One-way between-subjects ANOVA for equality of means, with Welch's ANOVA for unequal variances. Kruskal-Wallis non-parametric alternative. Bartlett, Levene, and Brown-Forsythe tests for homogeneity of variances. Descriptive statistics and side-by-side plots by group.
-
Build multi-factor models with ANOVA and ANCOVA
Multiple factors, crossed factors, polynomial terms, interactions, and continuous covariates. Categorical variables coded automatically. Full factorial and custom model structures. Type I and Type III tests for each term. ANCOVA with adjusted effect means.
-
Handle repeated measures designs
One-way within-subjects ANOVA for repeated measures. Friedman non-parametric alternative. Paired comparisons with appropriate error terms.
-
Answer the specific question with the right comparison
Nine multiple comparison procedures: Tukey-Kramer and Dwass-Steel-Critchlow-Fligner for all pairs; Dunnett and Steel against a control; Hsu with the best; Scheffe for all contrasts; Student's t and Wilcoxon-Mann-Whitney for individual comparisons. Mean-Mean scatter plot to visualise differences.
-
See how factors combine with interaction and effect plots
Estimated effect means with confidence intervals for each factor level. Main effect plots and interaction plots. Leverage plots to assess each term's contribution after accounting for all others.
-
Check assumptions with residual diagnostics
Raw and standardised residual plots, sequence and lag plots, residual distribution. Outlier and Influence plot using Cook's D and Studentised Residuals to identify observations with undue influence on the model.
-
Part of the Standard edition
ANOVA and ANCOVA are part of the Standard edition, which also covers simple and multiple regression, logistic regression, PCA and factor analysis, descriptive analysis, hypothesis testing, and categorical data analysis. All the professional statistics you need — at a fraction of the cost of dedicated packages.
Trusted by 75,000 researchers, analysts, and scientists at leading universities, hospitals, and companies worldwide — for over 30 years.
Try free for 15 days