Logistic regression with odds ratios and diagnostics
Binary logistic regression with continuous and categorical predictors — odds ratios, Wald and likelihood ratio tests, leverage plots, residual diagnostics, and Cook’s D influence analysis.
Model binary outcomes with the same iterative workflow
When the outcome is binary — survived or not, responded or not, defective or not — logistic regression is the standard modelling approach. But a table of coefficients isn’t what clinicians or stakeholders act on. They need odds ratios they can interpret, confidence intervals they can report, and evidence that the model isn’t being driven by a handful of unusual cases.
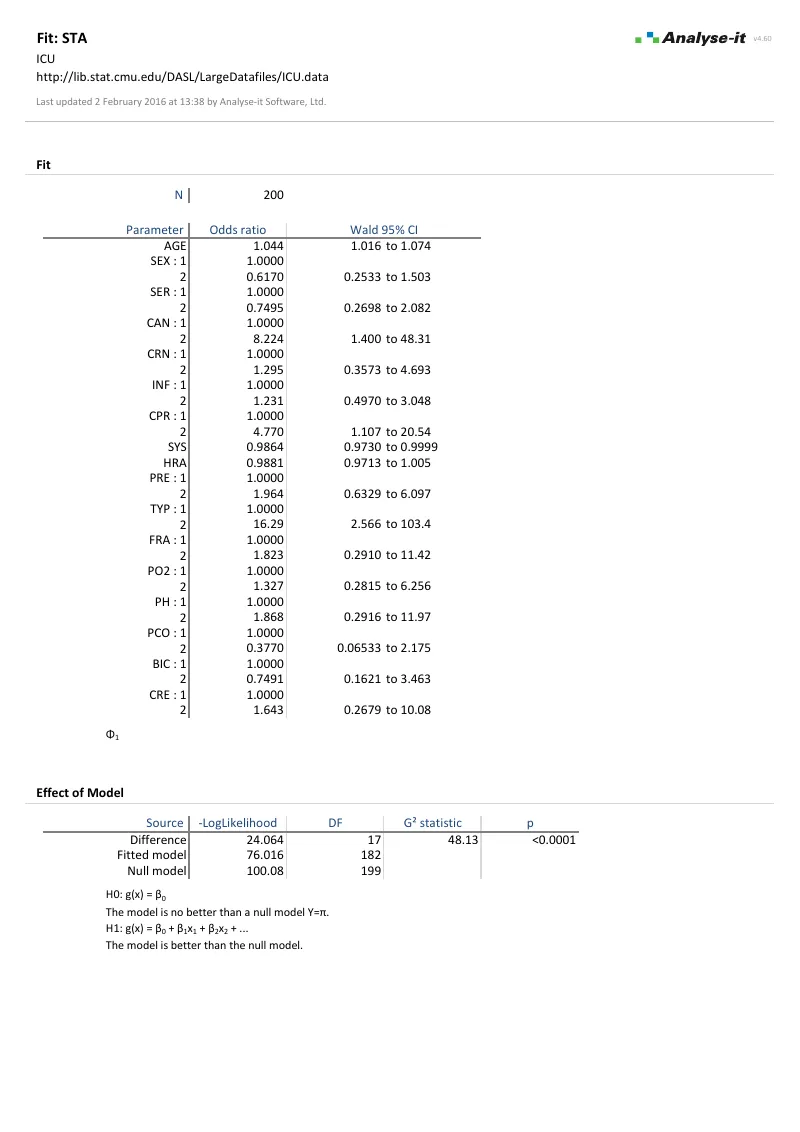
Odds ratios with confidence intervals, Wald and likelihood ratio tests for every term, inverse prediction at specified probabilities — and the same model-building workflow as linear regression, so you can add or drop predictors and see immediately how the fit changes.
Analyse-it has helped tremendously. Previously I used Prism and Microsoft Excel, but Analyse-it has made my life so much easier and saved so much time.
Man Khun Chan, M.Sc., ART
Test Development Medical Technologist
The Hospital For Sick Children, Toronto, Canada
What’s included
Odds ratios that clinicians can act on
Each predictor reported as an odds ratio with confidence interval — directly interpretable as the change in odds per unit increase. Parameter estimates with standard errors, Wald Z statistics, and significance tests for the underlying coefficients. Model equation for documentation.
Test each term and compare competing models
Wald and likelihood ratio tests tell you whether each predictor contributes to the model or can be dropped. Effect of model test shows whether the predictors collectively improve on the null. AIC, BIC, log-likelihood, and deviance for comparing nested models — add a term and see whether the fit improves enough to justify the complexity.
Predict the threshold for a given probability
Inverse prediction gives you the X value at which the outcome reaches a specified probability — with confidence intervals. For a dose-response study, that’s the dose at which 50% of subjects respond. For a diagnostic assay, it’s the concentration at which detection probability reaches 95%.
Example analyses
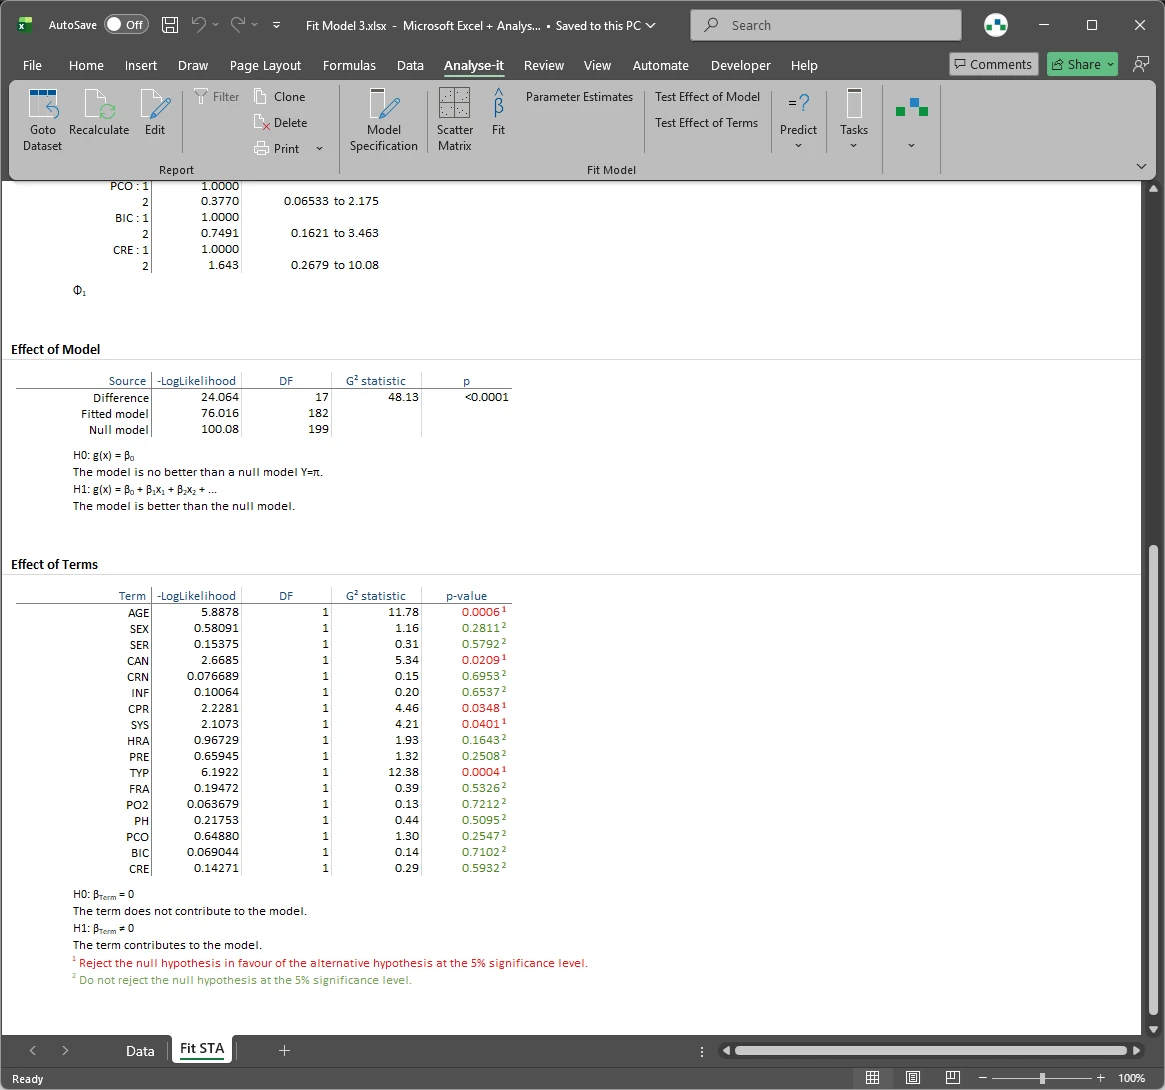
See logistic regression results in detail — odds ratios, model tests, leverage plots, and influence diagnostics.
Binary logistic regression
ICU patient survival, 17 predictors.
200 observations. Odds ratios with Wald 95% CIs, G² likelihood ratio test for model and each term. Age, cancer, CPR, systolic BP, and admission type significant at 5%.
Validated, reliable, trusted for over 30 years
NIST-validated calculations
Every statistic tested against NIST Standard Reference Datasets, published datasets and thousands of internal test-cases. No reliance on Excel's shaky built-in functions. See how we
develop and validate Analyse-it →
Data stays on your PC
No cloud processing, no uploads, no third-party access. Your data never leaves your computer — essential when working with sensitive, confidential, or patient-identifiable data.
Standard Excel workbooks
Analyses are ordinary Excel workbooks that you can share with colleagues, archive for audit, and open on any machine with Excel — no Analyse-it licence required.
No formulas to break
Results contain no formulas, so they can't be accidentally edited or corrupted. The results you reported will be exactly what you find when you reopen the workbook.
Technical details
Model
- Binary logistic regression
- Continuous and categorical predictors
- Simple, crossed, polynomial, and factorial terms
- Automatic dummy variable coding
- Model equation
- Scatter plot
Statistics
- Odds ratios with confidence intervals
- Parameter estimates with standard errors and Wald Z statistics
- Covariance of estimates matrix
- Effect of model: likelihood ratio or Wald χ² test
- Effect of terms: likelihood ratio or Wald χ² test for each term
Prediction
- Inverse prediction: predict X given probability, with confidence interval