Hypothesis testing for comparing groups and pairs
t-tests, Wilcoxon, Mann-Whitney, Welch’s ANOVA, Kruskal-Wallis, Friedman, nine multiple comparison procedures, and Cohen’s d effect sizes — parametric and non-parametric.
The right test for the comparison you need to make
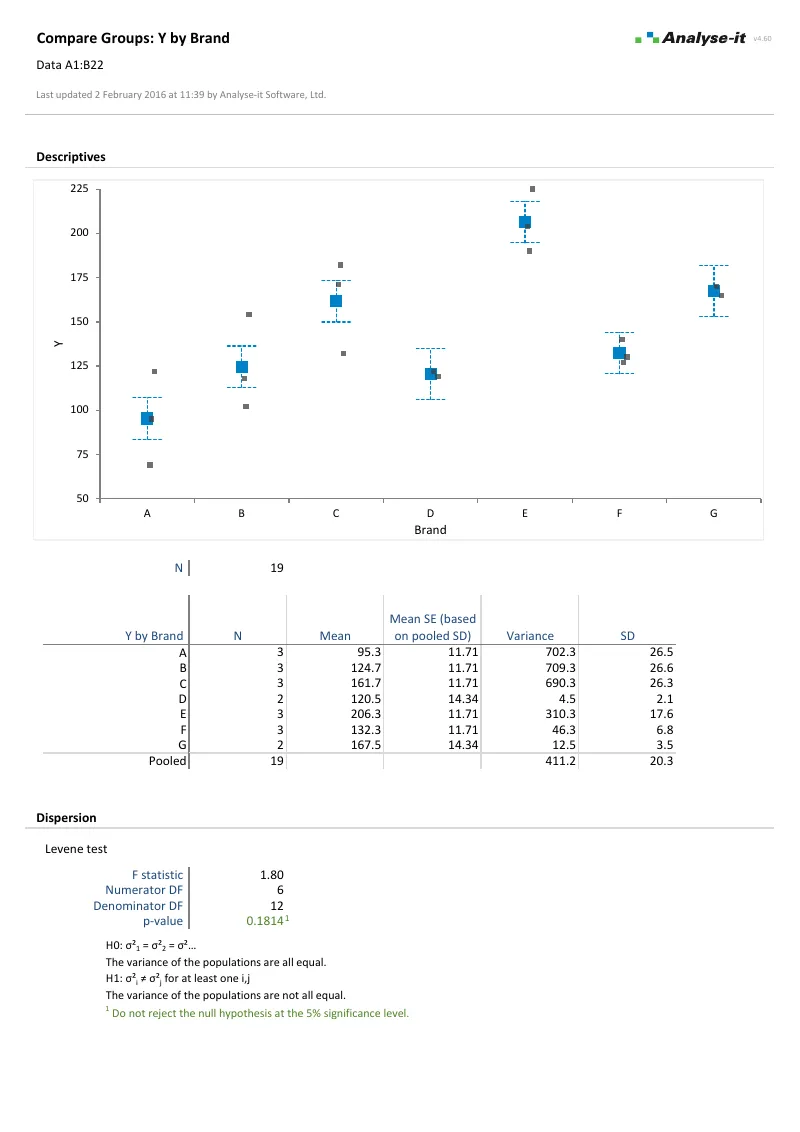
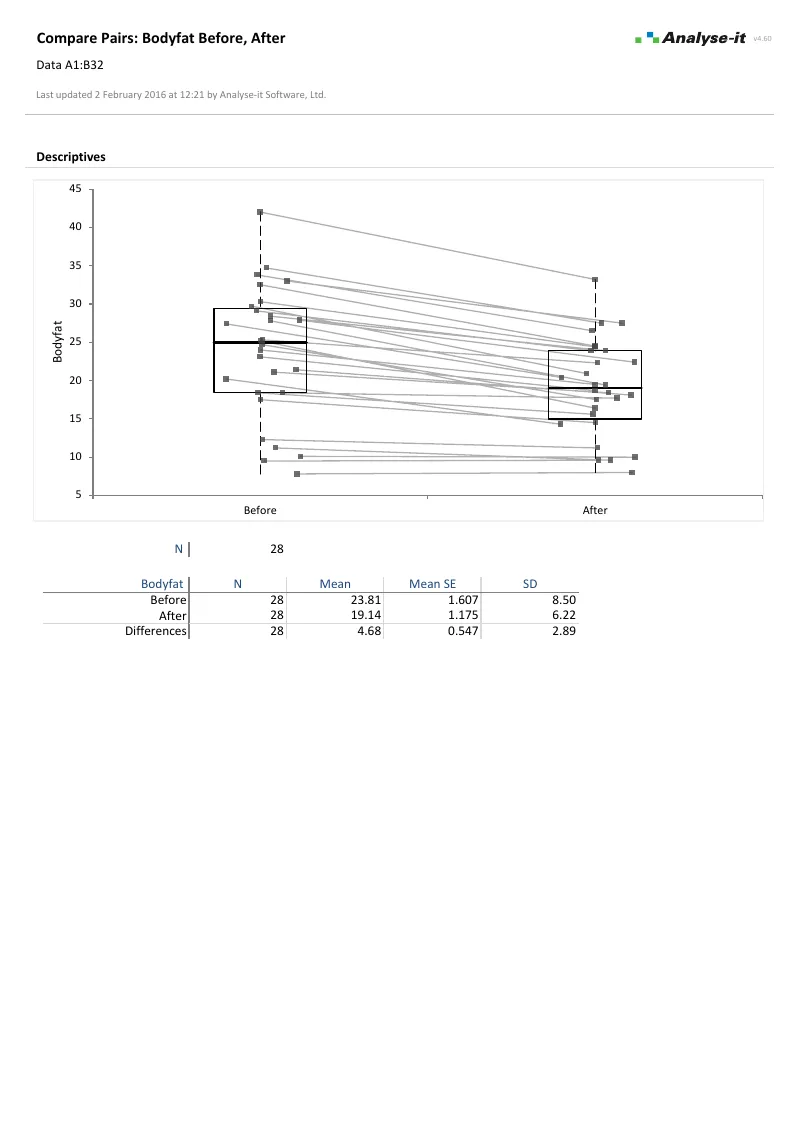
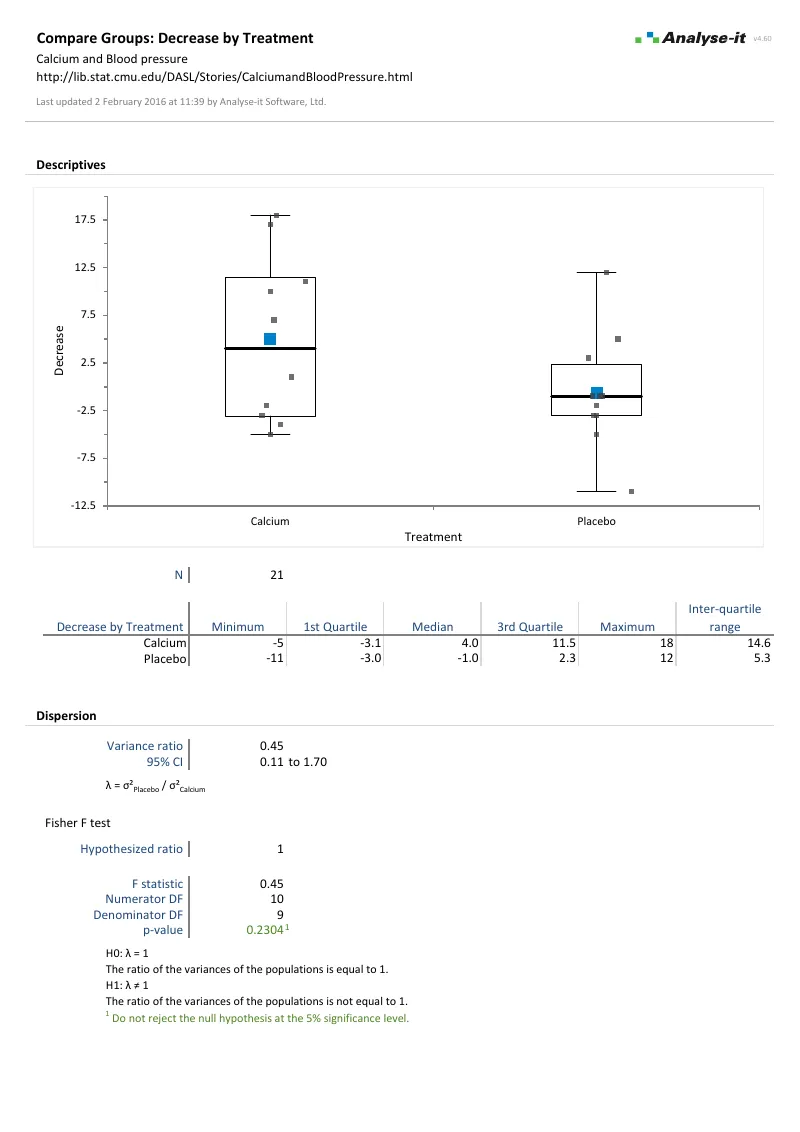
Two groups or ten. Independent or paired. Normal or not. Equal variances or not. Each combination calls for a different test, and choosing the wrong one invalidates the conclusion. Use a t-test when you should use Welch’s and you understate the uncertainty. Use a parametric test on skewed data and the p-value is unreliable. The assumption checks aren’t optional — they determine which test gives a valid answer.
And knowing that groups differ is only the start. A significant p-value doesn’t tell you which groups differ, by how much, or whether the difference is large enough to matter. That takes multiple comparison procedures, effect sizes with confidence intervals, and plots that show the data alongside the statistics — all in the same analysis, not pieced together from separate tools.
I’ve tried different statistical packages (e.g. SPSS, Minitab) and none are as easy or intuitive and the fact it is an add in to Excel is also very handy. The statistical guides are also really useful.
What’s included
Compare independent groups
Two groups: Student’s t-test when variances are equal, Welch’s t-test when they’re not, Wilcoxon-Mann-Whitney when normality is in doubt. Three or more groups: one-way ANOVA, Welch’s ANOVA, or Kruskal-Wallis. Side-by-side dot plots with confidence diamonds show the group distributions before you commit to a test.
Compare paired and repeated measures
Before-and-after, matched pairs, repeated observations on the same subjects. Paired t-test, Wilcoxon signed ranks, and Sign test for two time points. Within-subjects ANOVA and Friedman for three or more. The difference plot with histogram shows the distribution of individual changes — not just the average.
Find out which groups differ, not just that something does
A significant ANOVA tells you the groups aren’t all equal — but not which ones differ. Nine multiple comparison procedures answer the specific follow-up question: all pairs with Tukey-Kramer, against a control with Dunnett, with the best using Hsu. Non-parametric alternatives with Steel and Dwass-Steel-Critchlow-Fligner. The Mean-Mean scatter plot shows every pairwise difference at a glance.
Quantify the size of the difference
A p-value tells you whether a difference exists. Cohen’s d and Hedges’ g tell you how large it is, on a standardized scale with non-central t confidence intervals. Mean difference with CI for the raw scale. Hodges-Lehmann location shift for a robust non-parametric estimate. Report both the significance and the magnitude.
Check the assumptions before committing
The choice between Student’s t and Welch’s t depends on whether variances are equal. F-test for two groups, Bartlett, Levene, and Brown-Forsythe for three or more. When the assumption fails, the alternative is right there in the same analysis — switch to Welch’s t-test, Welch’s ANOVA, or a non-parametric test without starting over.
Example analyses
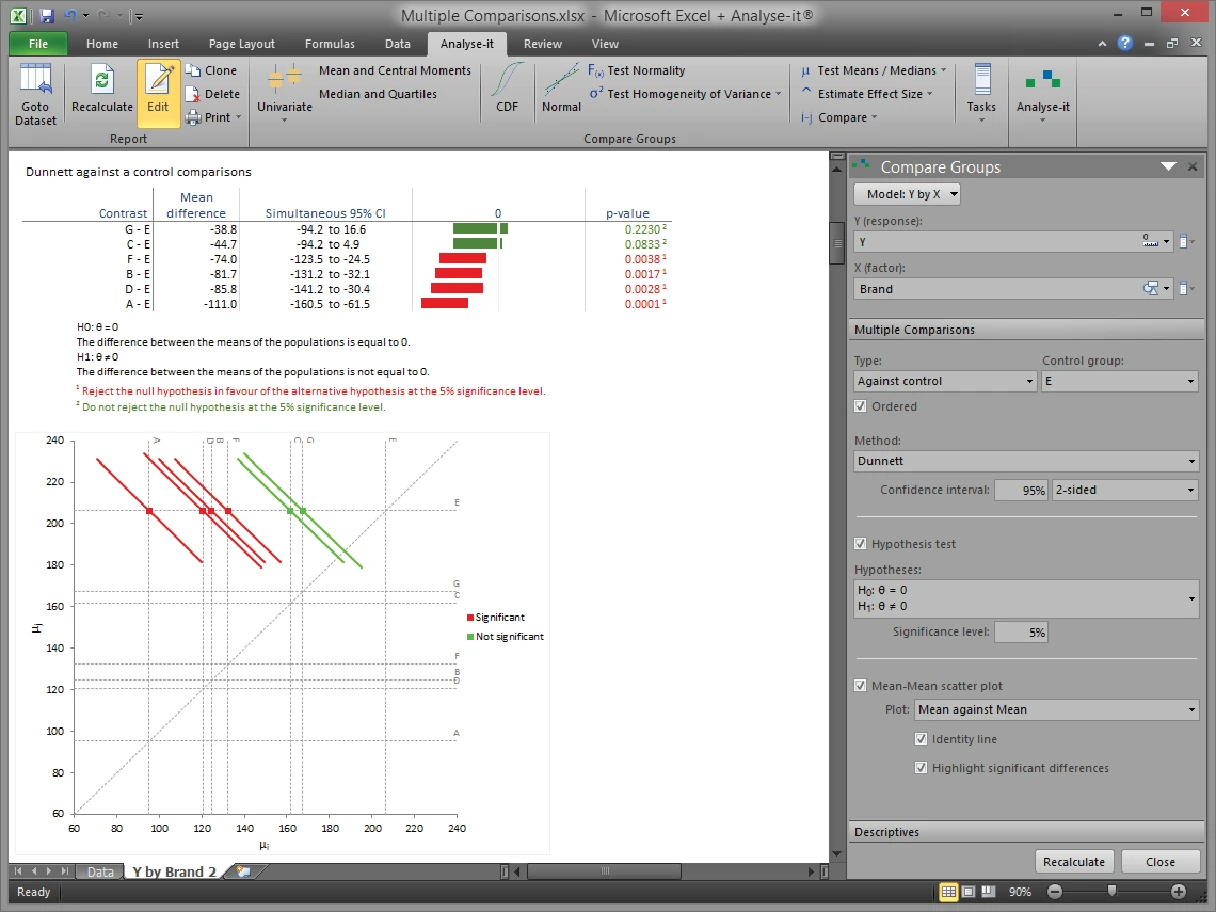
See hypothesis test results in detail — t-tests, ANOVA, multiple comparisons, and effect sizes.
Compare groups — t-test
Calcium supplementation and blood pressure.
2 groups (11 calcium, 10 placebo). Side-by-side box plots, Fisher F-test, independent-samples t-test against hypothesised difference of 3.
Compare groups — one-way ANOVA
Y by brand, 7 groups.
Dot plots with confidence diamonds, Levene’s test, one-way ANOVA, Tukey-Kramer with 21 contrasts, Mean-Mean scatter plot.
Compare pairs
Body fat before and after exercise.
28 paired observations. Box plots with paired lines, difference plot with Hodges-Lehmann shift and 95% CI, Wilcoxon signed-ranks.
Validated, reliable, trusted for over 30 years
NIST-validated calculations
Every statistic tested against NIST Standard Reference Datasets, published datasets and thousands of internal test-cases. No reliance on Excel's shaky built-in functions. See how we
develop and validate Analyse-it →
Data stays on your PC
No cloud processing, no uploads, no third-party access. Your data never leaves your computer — essential when working with sensitive, confidential, or patient-identifiable data.
Standard Excel workbooks
Analyses are ordinary Excel workbooks that you can share with colleagues, archive for audit, and open on any machine with Excel — no Analyse-it licence required.
No formulas to break
Results contain no formulas, so they can't be accidentally edited or corrupted. The results you reported will be exactly what you find when you reopen the workbook.
Technical details
Compare groups (independent)
- Descriptive statistics by group
- Side-by-side dot plots, mean plots, box plots
- Z test for difference in means (known SDs)
- Student’s independent samples t-test
- Welch’s t-test for unequal variances
- Wilcoxon-Mann-Whitney test
- 1-way between-subjects ANOVA
- Welch’s ANOVA for unequal variances
- Kruskal-Wallis test
Compare pairs (dependent)
- Descriptive statistics for each group
- Side-by-side dot plots, mean plots, box plots
- Difference plot with identity line and histogram
- Z test for difference in means (known SDs)
- Student’s paired t-test
- Wilcoxon signed ranks test
- Sign test for median
- 1-way within-subjects ANOVA
- Friedman test
Multiple comparisons
- All pairs: Tukey-Kramer, Dwass-Steel-Critchlow-Fligner
- Against control: Dunnett, Steel
- With best: Hsu
- All contrasts: Scheffé
- Individual: Student’s t, Wilcoxon-Mann-Whitney
- Mean-Mean scatter plot
Variance tests
- F-test for variance ratio
- Bartlett test for homogeneity
- Levene test for homogeneity
- Brown-Forsythe test for homogeneity
Effect size estimators
- Mean difference with t-based, Welch-Satterthwaite, or Z-based CI
- Cohen’s d and Hedges’ g with non-central t CI
- Hodges-Lehmann location shift with Moses CI (independent)
- Hodges-Lehmann location shift with Tukey CI (paired)
- Median difference with Thompson-Savur CI