Correlation analysis with scatter plots and matrices
Pearson, Spearman, and Kendall correlation coefficients with confidence intervals — colour-mapped correlation matrices, scatter plot matrices, and tests for linear and monotonic association.
See the relationships before you model them
Correlation is the exploratory step between describing variables individually and fitting a regression model. Which variables are related? How strongly? Is the relationship linear, monotonic, or something else entirely? A coefficient alone won’t tell you — a strong Pearson r can hide a non-linear pattern, and a weak r can mask a relationship that’s clear in a subgroup but absent in another.
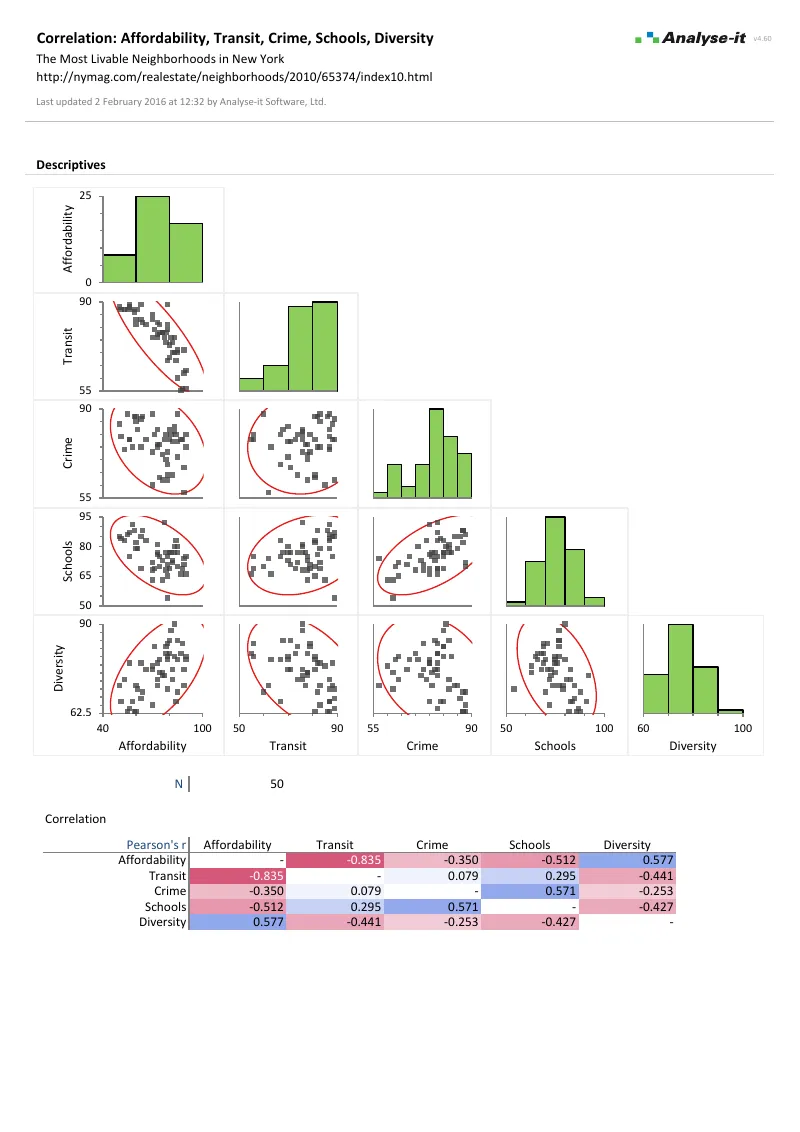
You need both the numbers and the pictures. Pearson, Spearman, and Kendall coefficients with proper confidence intervals give you the strength and significance. Colour-mapped correlation matrices and scatter plot matrices show you the patterns, the clusters, and the outliers that a single number misses.
A-I produces graphs and analyses which wrap around excel to offer a wide range of easy to use, easy to understand outputs; these are most useful when using statistics in reports which readers may not otherwise be comfortable “interpreting.”
Ken O.
President & CEO
Real Estate
What’s included
See every pairwise relationship at a glance
The colour-mapped correlation matrix shows the strength and direction of every pairwise relationship — strong positive in one colour, strong negative in another, weak associations fading toward neutral. With many variables, the pattern of which clusters together is visible immediately without reading individual numbers.
See the data behind the coefficients
A correlation coefficient summarises a relationship in one number. A scatter plot matrix shows what that number hides — non-linear patterns, clusters, outliers, and subgroups that behave differently from the whole. Colour observations by a factor to see whether a relationship that holds overall breaks down within groups, or one that looks weak overall is strong within each group.
The right coefficient for the relationship
Pearson r measures linear association. Spearman rs measures monotonic association — use it when the relationship is consistent in direction but not necessarily straight. Kendall τ measures concordance and is more robust with small samples or tied values. Each with a proper confidence interval and significance test, not just a point estimate.
Example analyses
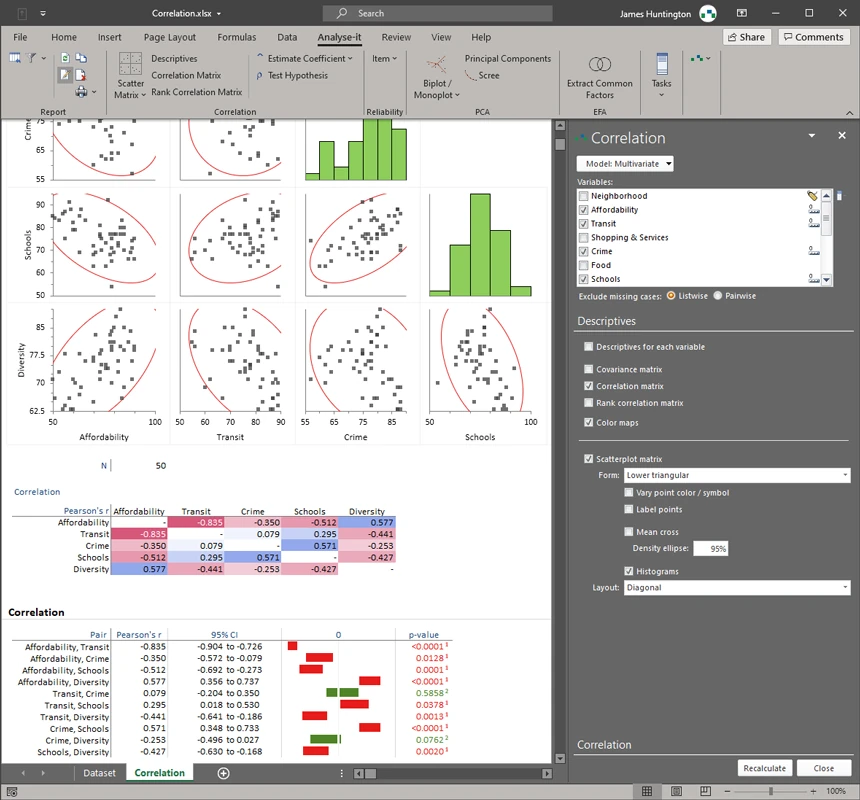
See correlation results in detail — colour-mapped matrices, scatter plot matrices, and pairwise coefficients with CIs.
Correlation matrix
NYC neighbourhood liveability, 50 observations × 5 variables.
Colour-mapped correlation matrix, scatter plot matrix with distribution histograms, pairwise Pearson r with Fisher’s Z 95% CIs and significance tests.
Validated, reliable, trusted for over 30 years
NIST-validated calculations
Every statistic tested against NIST Standard Reference Datasets, published datasets and thousands of internal test-cases. No reliance on Excel's shaky built-in functions. See how we
develop and validate Analyse-it →
Data stays on your PC
No cloud processing, no uploads, no third-party access. Your data never leaves your computer — essential when working with sensitive, confidential, or patient-identifiable data.
Standard Excel workbooks
Analyses are ordinary Excel workbooks that you can share with colleagues, archive for audit, and open on any machine with Excel — no Analyse-it licence required.
No formulas to break
Results contain no formulas, so they can't be accidentally edited or corrupted. The results you reported will be exactly what you find when you reopen the workbook.
Technical details
Correlation / Association
- Pearson r correlation coefficient with Fisher’s Z CI
- Pearson test for linear association
- Spearman rs correlation coefficient with Fisher’s Z CI
- Kendall τ correlation coefficient with Samara-Randles CI
- Kendall test for monotonic association
Matrices & plots
- Correlation matrix with colour map on coefficients
- Covariance matrix
- Scatter plot
- Scatter plot matrix
- Vary points by colour based on a factor