Excel’s built-in ANOVA produces a one-way table and stops. No multiple comparisons, no covariates, no multi-factor models, no diagnostics. But most real experiments don’t have a single factor — and knowing that “something differs” is rarely the question you need answered. Which groups differ? By how much? Does adding a covariate change the conclusion? Does the effect of one factor depend on the level of another?
Answering those questions takes multi-factor ANOVA with interaction terms, ANCOVA with covariates, nine multiple comparison procedures that each control the error rate for a different type of question, and the diagnostic plots to confirm the model is trustworthy before you report the result. The same iterative build-examine-refine workflow as regression — because an ANOVA model has the same assumptions and the same ways of going wrong.

See ANOVA results in detail — ANOVA tables, multiple comparisons, interaction plots, and diagnostics — using real datasets you can download and follow along with.
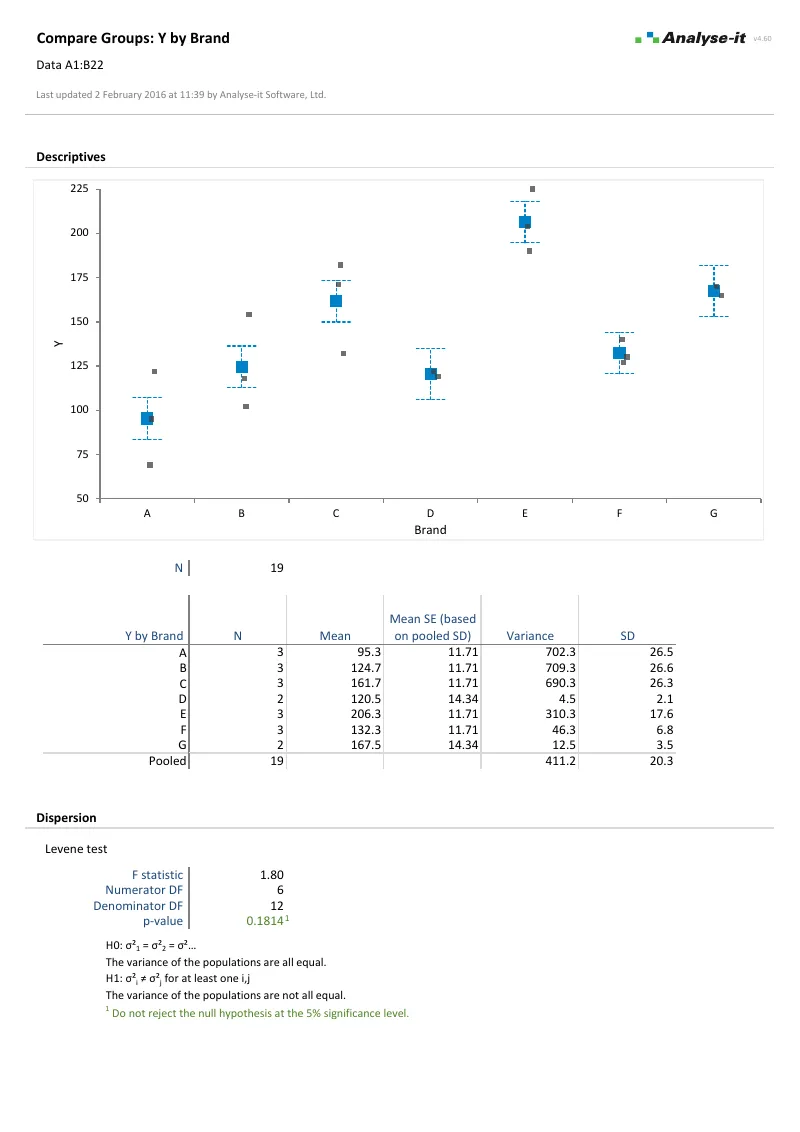
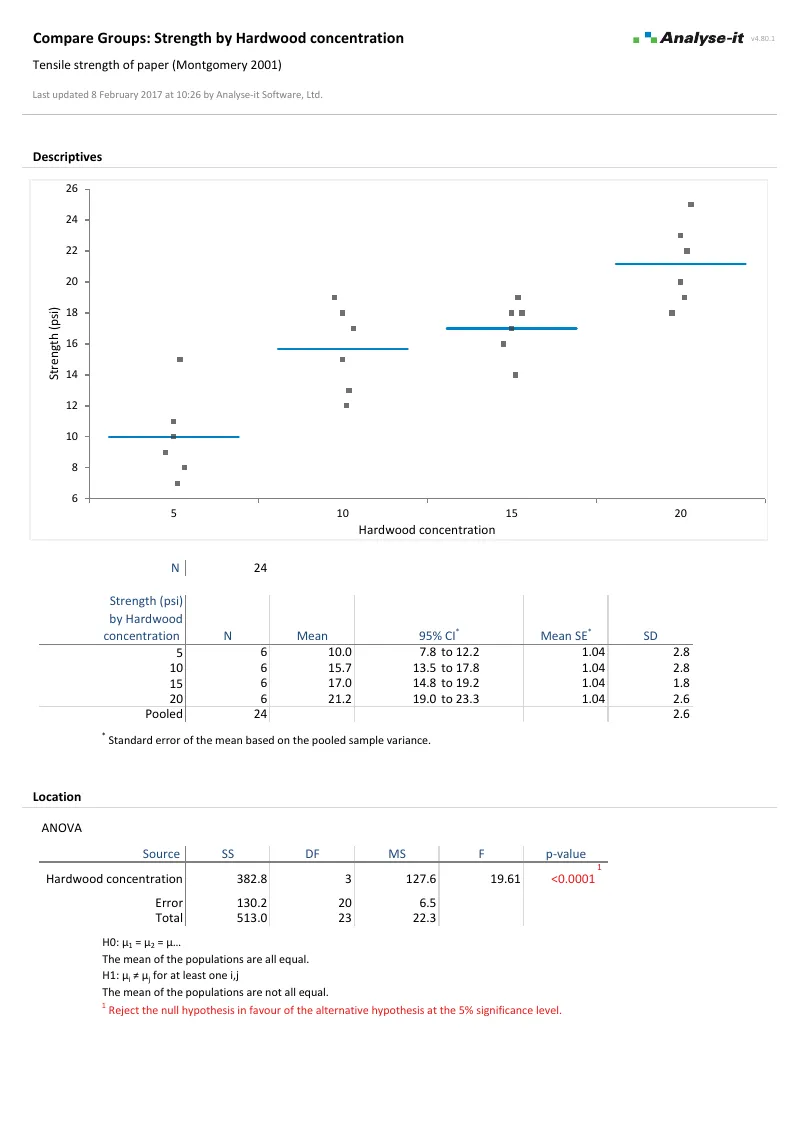 One-way ANOVA
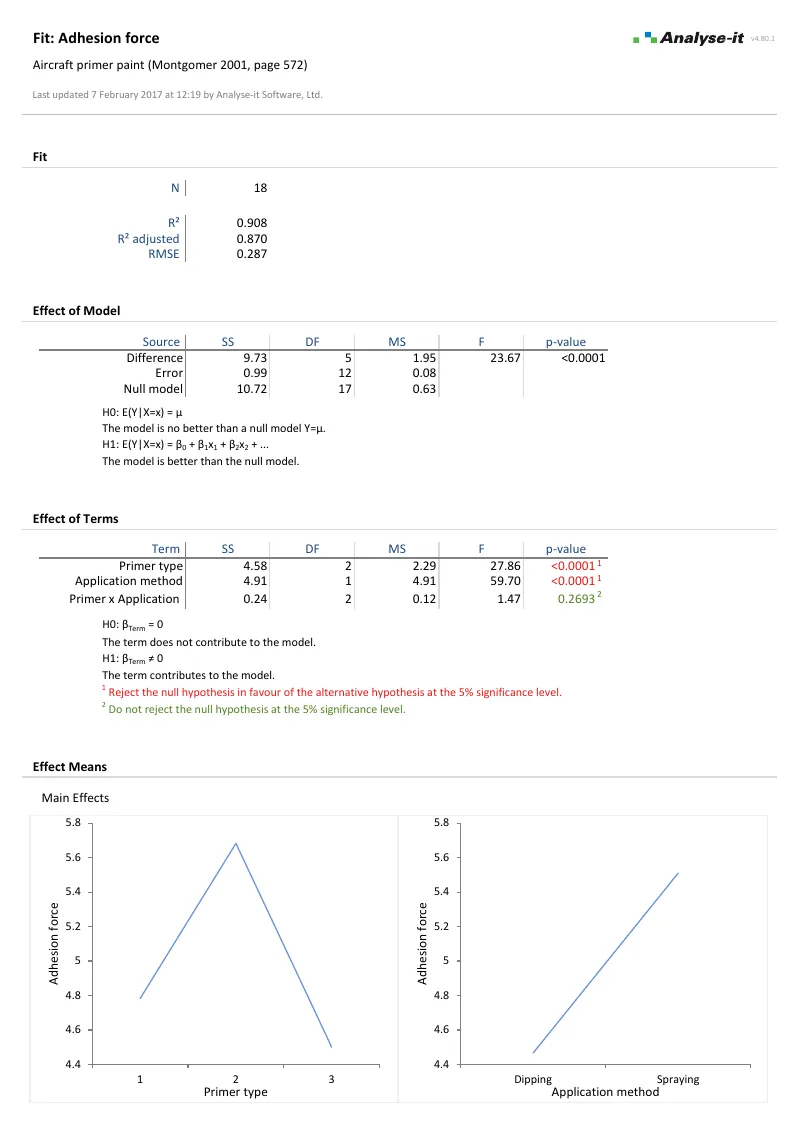 Two-way ANOVA
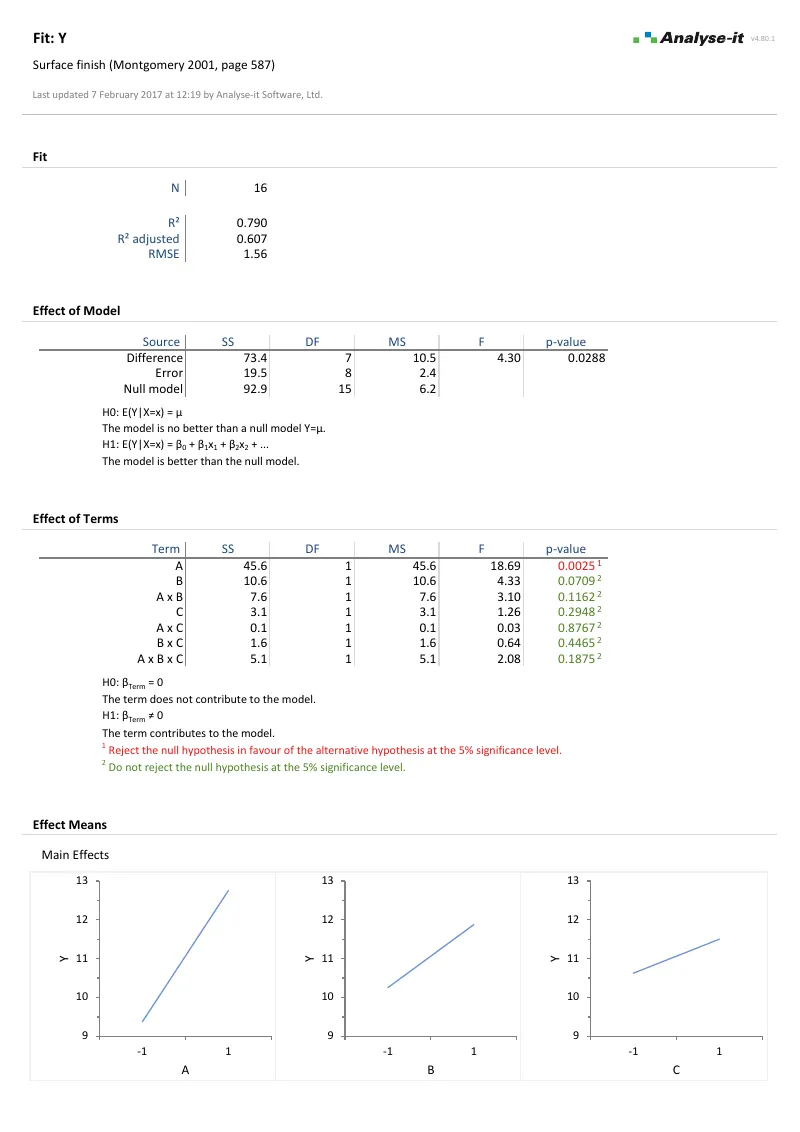 2³ full factorial
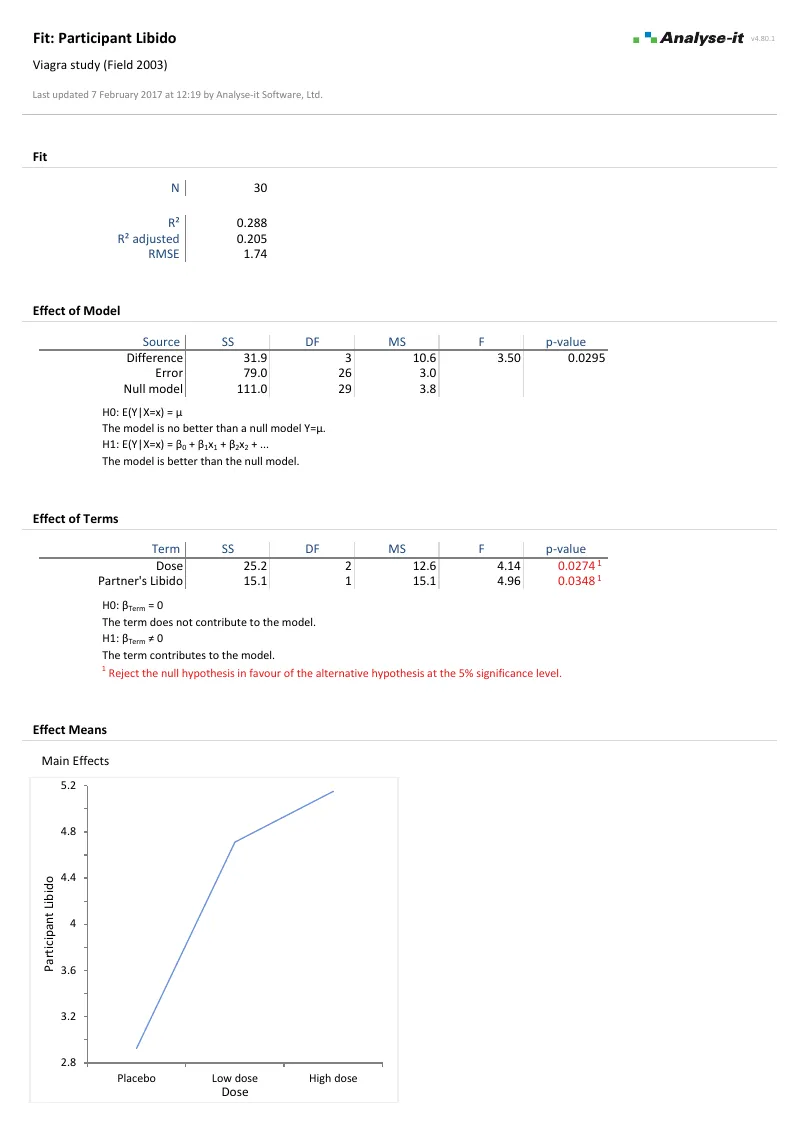 ANCOVA
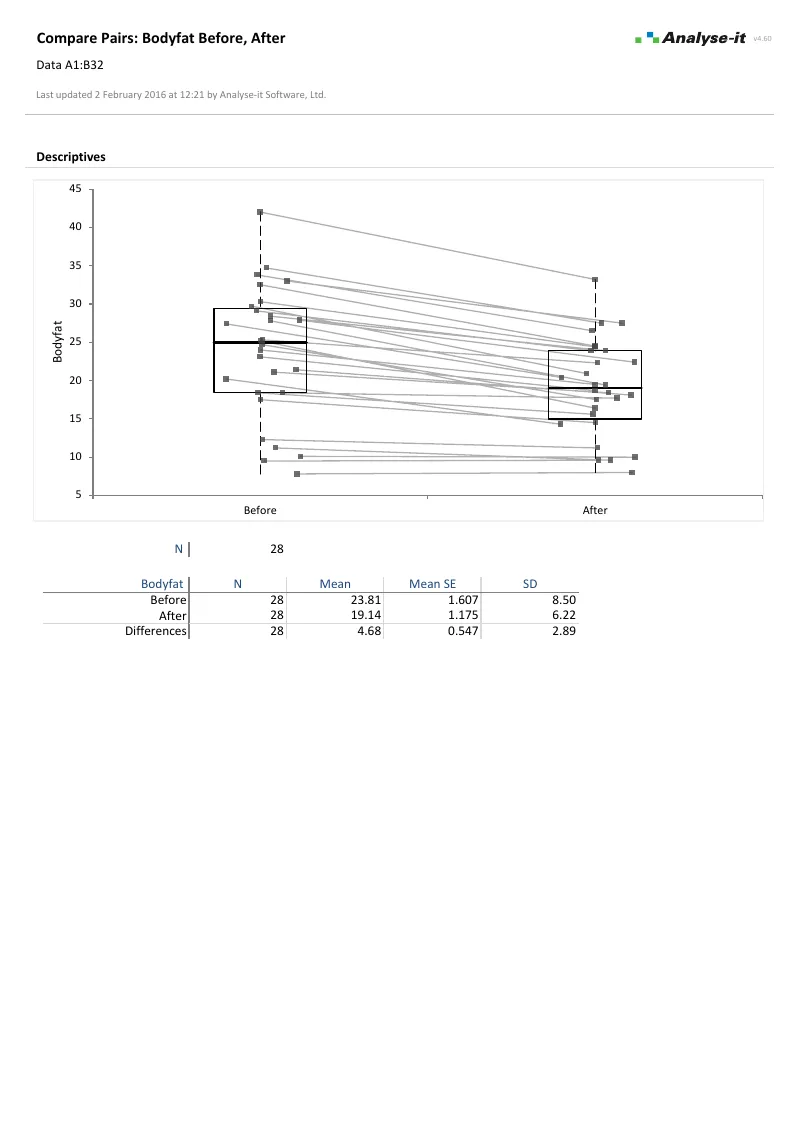
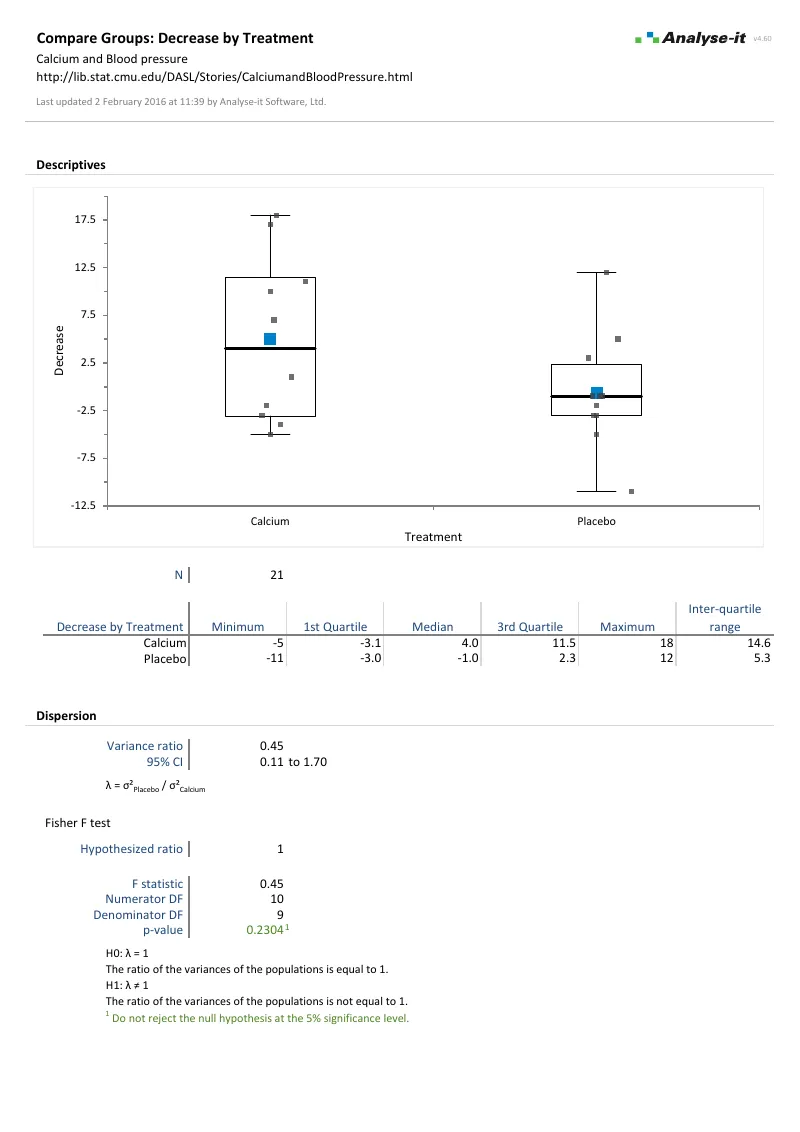 Compare groups — t-test
ANOVA and ANCOVA are one part of a complete statistical analysis toolkit. The Standard edition also includes simple and multiple regression, logistic regression, PCA and factor analysis, descriptive statistics, hypothesis testing, correlation, and categorical data analysis. See everything in the Standard edition →