Medical statistics software for research and publication Survival analysis, logistic regression, ROC curves, Bland-Altman agreement, reference intervals, contingency tables, ANOVA, regression, and multivariate methods — the complete clinical statistics toolkit for peer-reviewed publication.
Trusted by 75,000 researchers, analysts, and scientists at leading universities, hospitals, and companies worldwide — for over 30 years.
Every analysis in one package
Survival analysis, logistic regression, ROC curves, Bland-Altman, reference intervals, hypothesis tests, ANOVA, regression, and contingency tables. One tool for the full range of clinical research statistics, not a patchwork of separate applications.
Defensible at peer review
Every calculation runs in Analyse-it's own validated engine — no Excel formulas, no third-party functions. Validated before every release so the numbers in your manuscript can be defended under reviewer scrutiny.
Patient data stays local
Analyse-it runs entirely within Excel on your PC. No cloud processing, no data transmission — your patient data stays under institutional data governance and ethics approval controls.
Clinical research typically requires statistics from several domains — time-to-event analysis for outcomes, logistic regression for prediction models, ROC curves for diagnostic evaluation, agreement analysis for comparing measurement methods, and the standard toolkit of hypothesis tests, ANOVA, and regression for everything else. Most researchers end up piecing this together across multiple tools, each with its own interface, its own file format, and its own learning investment. Results end up scattered across applications, and sharing with co-authors means everyone needs the same software.
Analyse-it covers all of it in one package inside Excel. Kaplan-Meier with four group comparison tests and Cox proportional hazards modelling. Binary logistic regression with odds ratios, model fit statistics, and influence diagnostics. ROC curves with DeLong AUC comparison, optimal threshold determination, and the full set of diagnostic accuracy measures. Bland-Altman limits of agreement with non-constant precision handling and replicate support. Reference intervals with parametric, non-parametric, robust, and bootstrap methods. Contingency tables with Fisher exact, McNemar, and risk estimation. ANOVA and ANCOVA with nine multiple comparison procedures. Simple and multiple regression with full diagnostics. The workflow is consistent across all of these — the same interface, the same workbook, the same output format.
Your data stays in Excel throughout — no importing into a separate application, no proprietary file formats, no exporting results back. Share the workbook with a co-author and they see everything. Every calculation runs in Analyse-it's own validated engine, so the numbers in a manuscript can be defended under peer review.
75,000 researchers, analysts, and scientists at leading universities, hospitals, and research institutions have relied on Analyse-it for over 30 years.
What's included
-
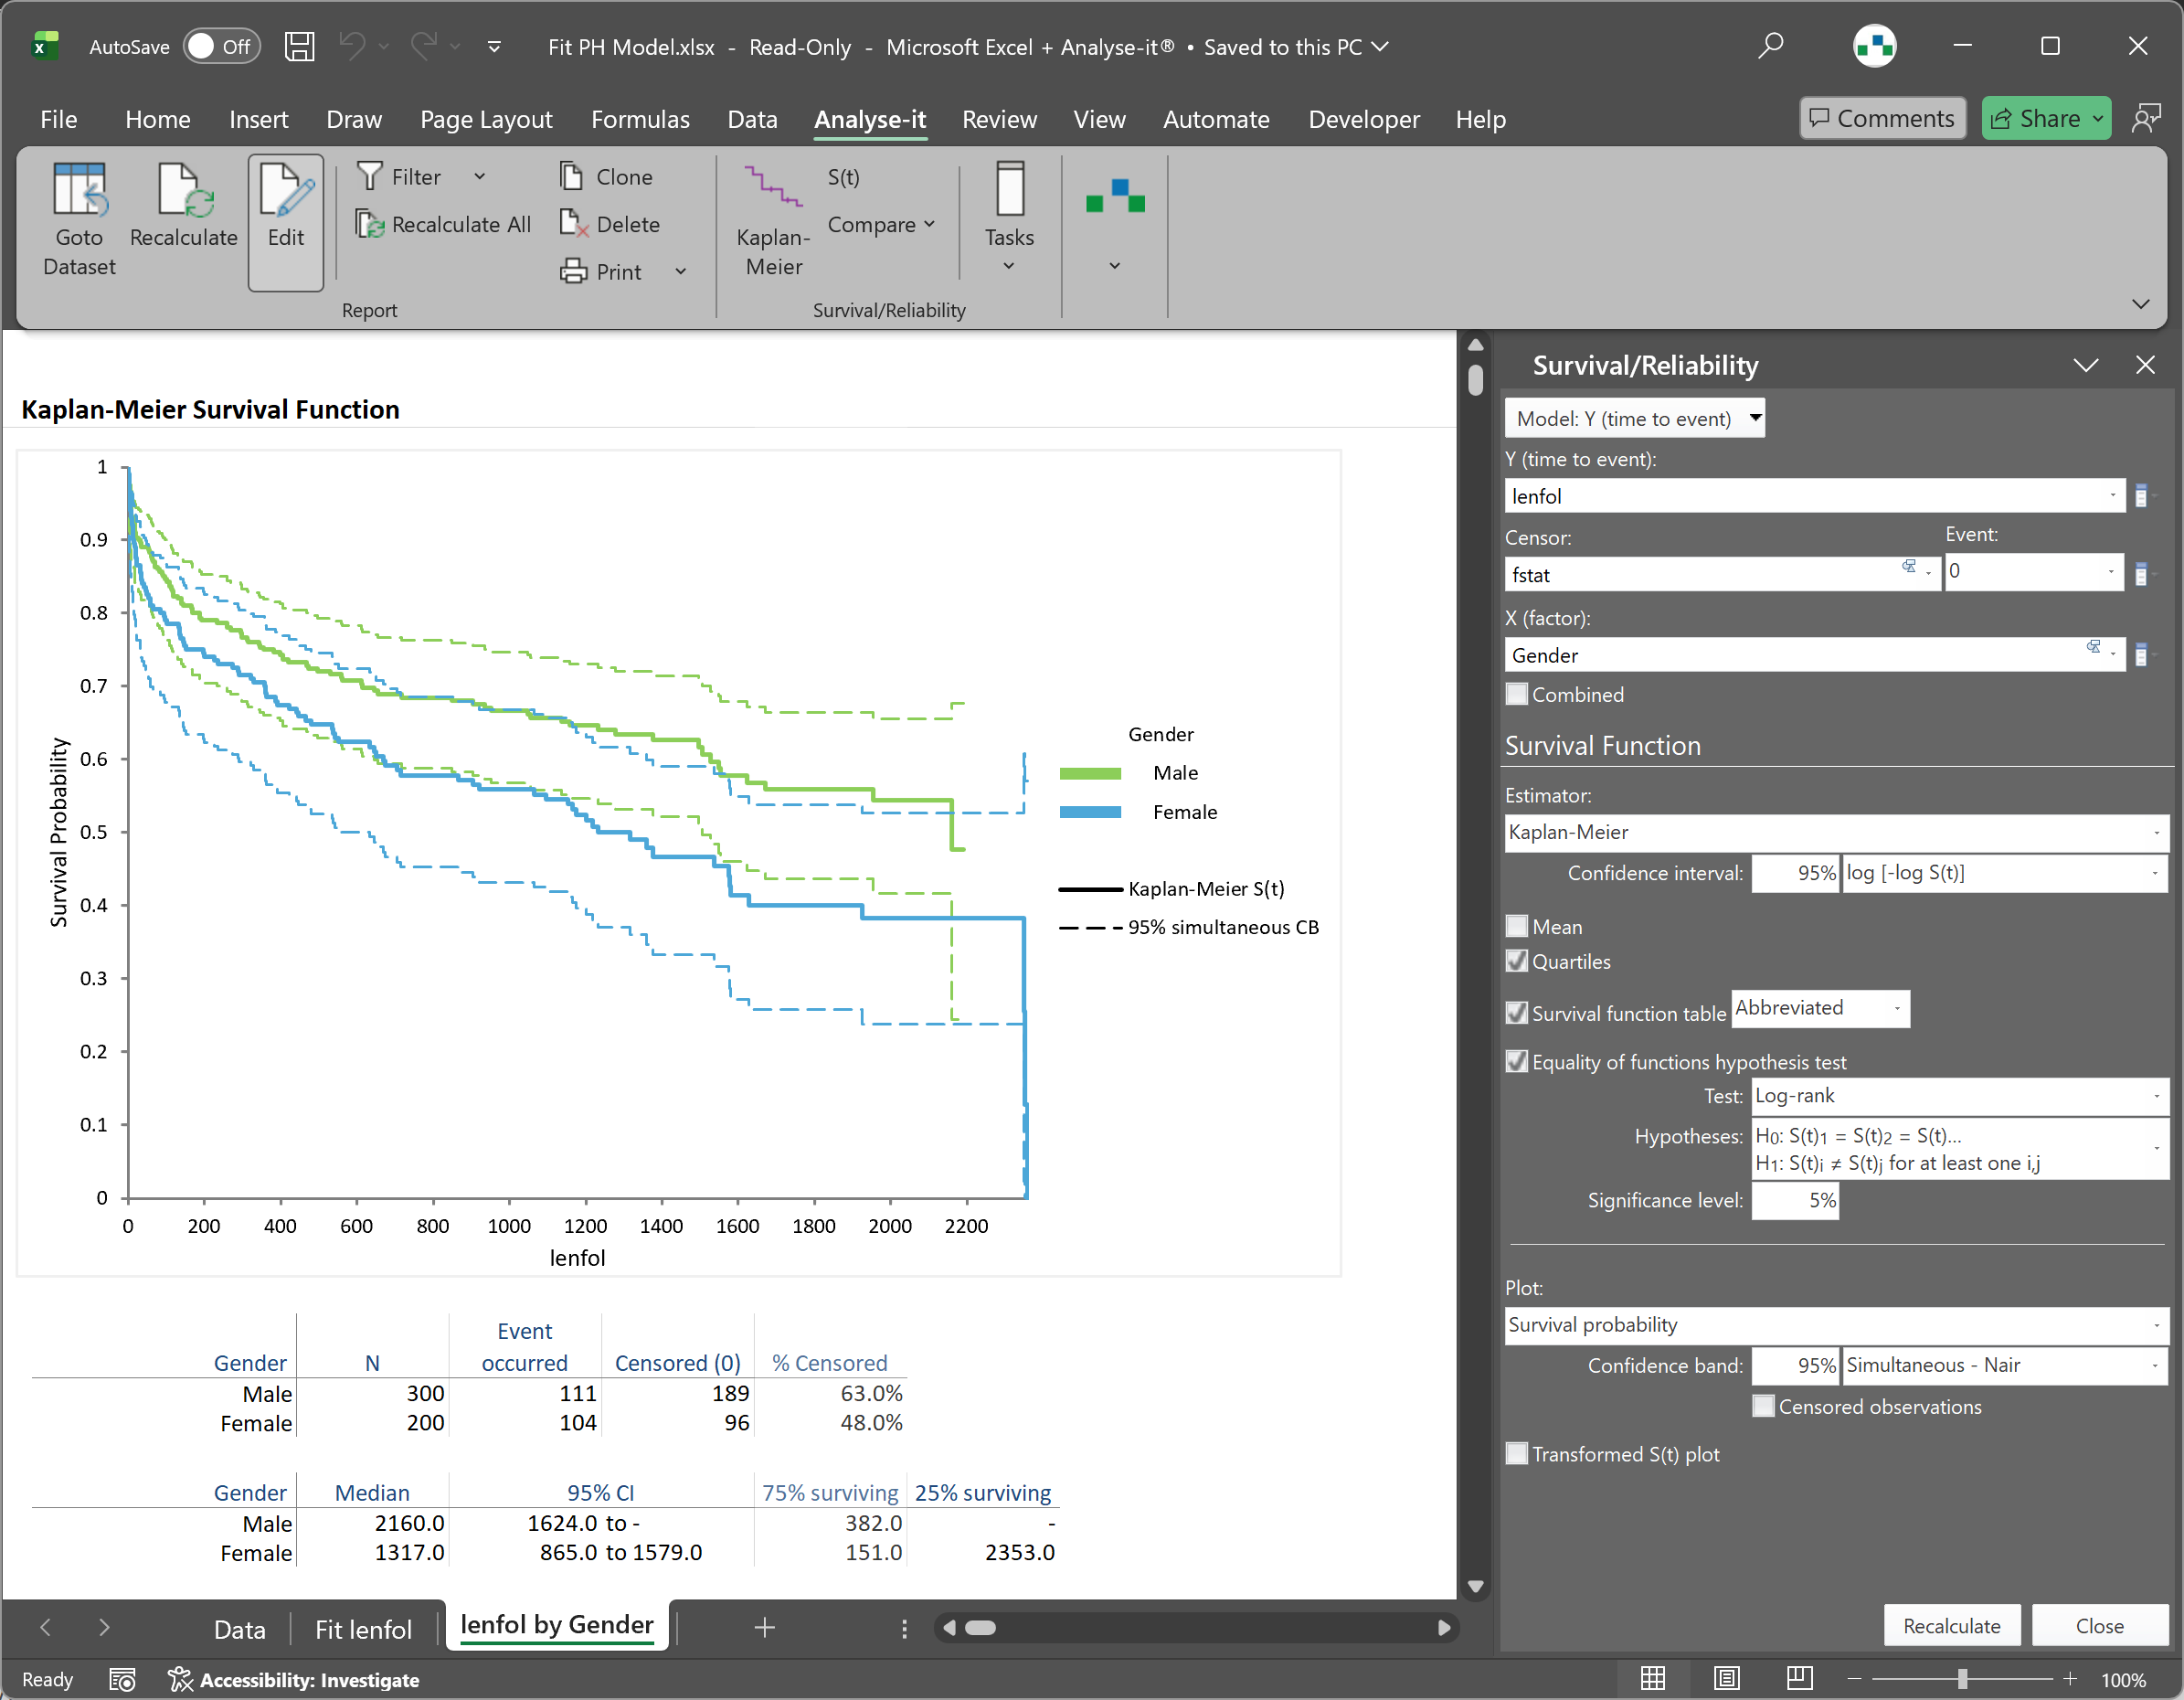
Analyse time-to-event outcomes
Kaplan-Meier survival curves with pointwise, Nair, and Hall-Wellner confidence bands. Log-rank, Wilcoxon, Tarone-Ware, and Fleming-Harrington group comparison tests. Cox proportional hazards with hazard ratios, likelihood-ratio tests, and baseline survival. Median, quartile, and restricted mean survival time. See survival analysis details.
-
Build clinical prediction models
Binary logistic regression with odds ratios, confidence intervals, AIC/BIC, likelihood-ratio and Wald tests. Leverage plots, residual diagnostics, and Cook's influence. Predict probabilities for new observations. See logistic regression details.
-
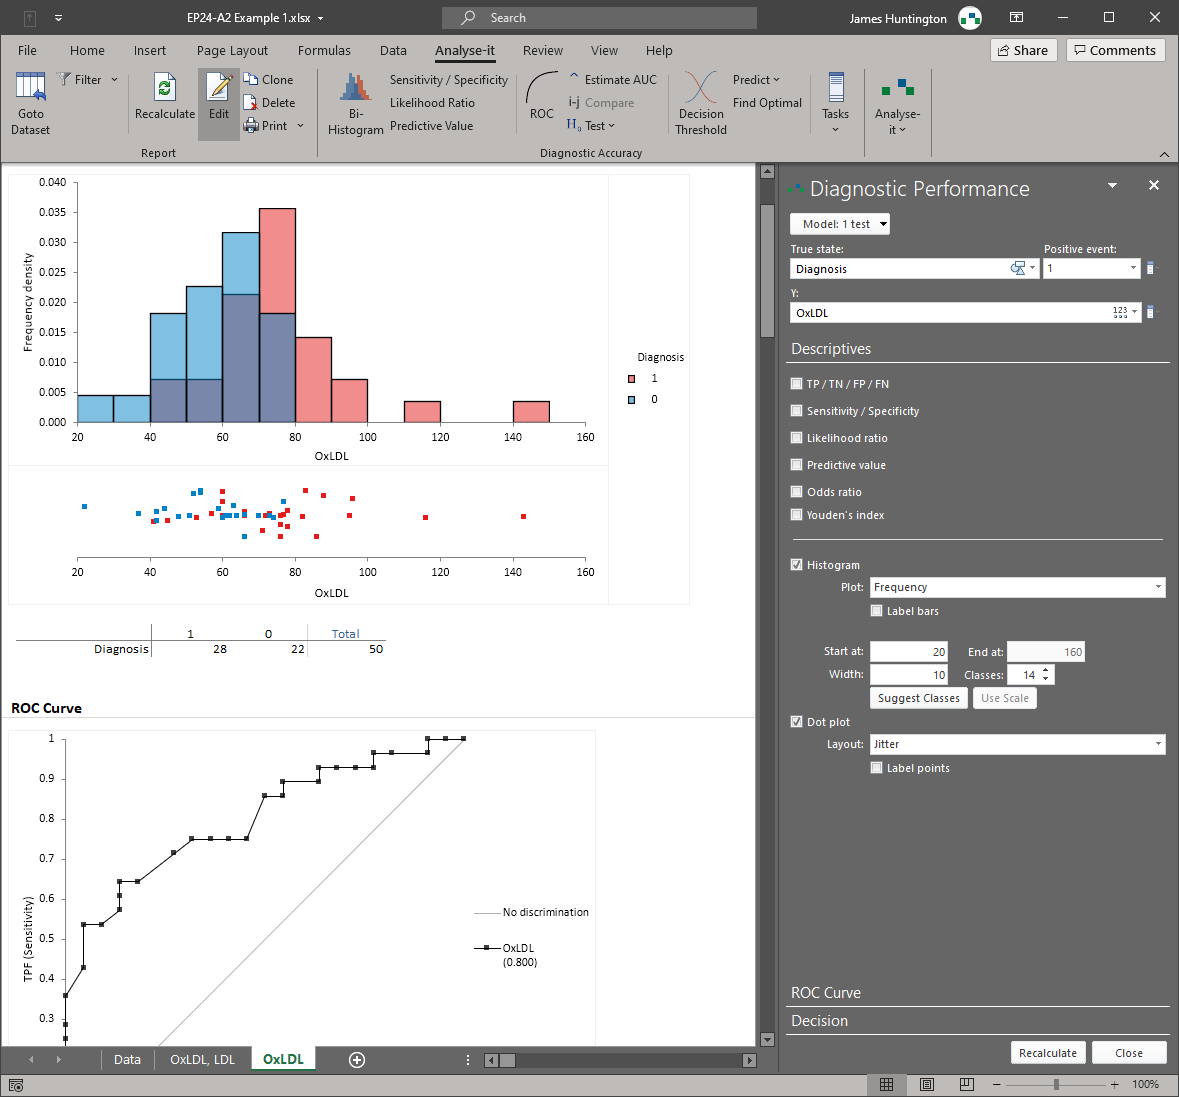
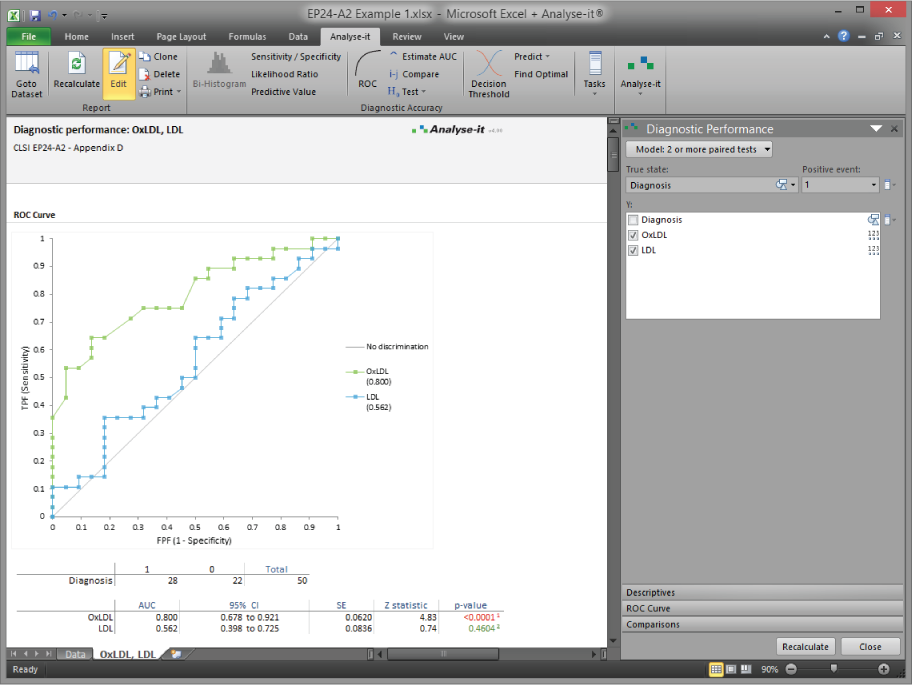
Evaluate diagnostic test accuracy
ROC curves with DeLong AUC and confidence intervals. Compare up to 10 tests. Sensitivity, specificity, likelihood ratios, predictive values. Optimal threshold by Youden index or cost-based optimisation. Qualitative test evaluation per EP12-A2. Rated best ROC curve software — Clinical Chemistry, March 2003. See diagnostic accuracy details.
-
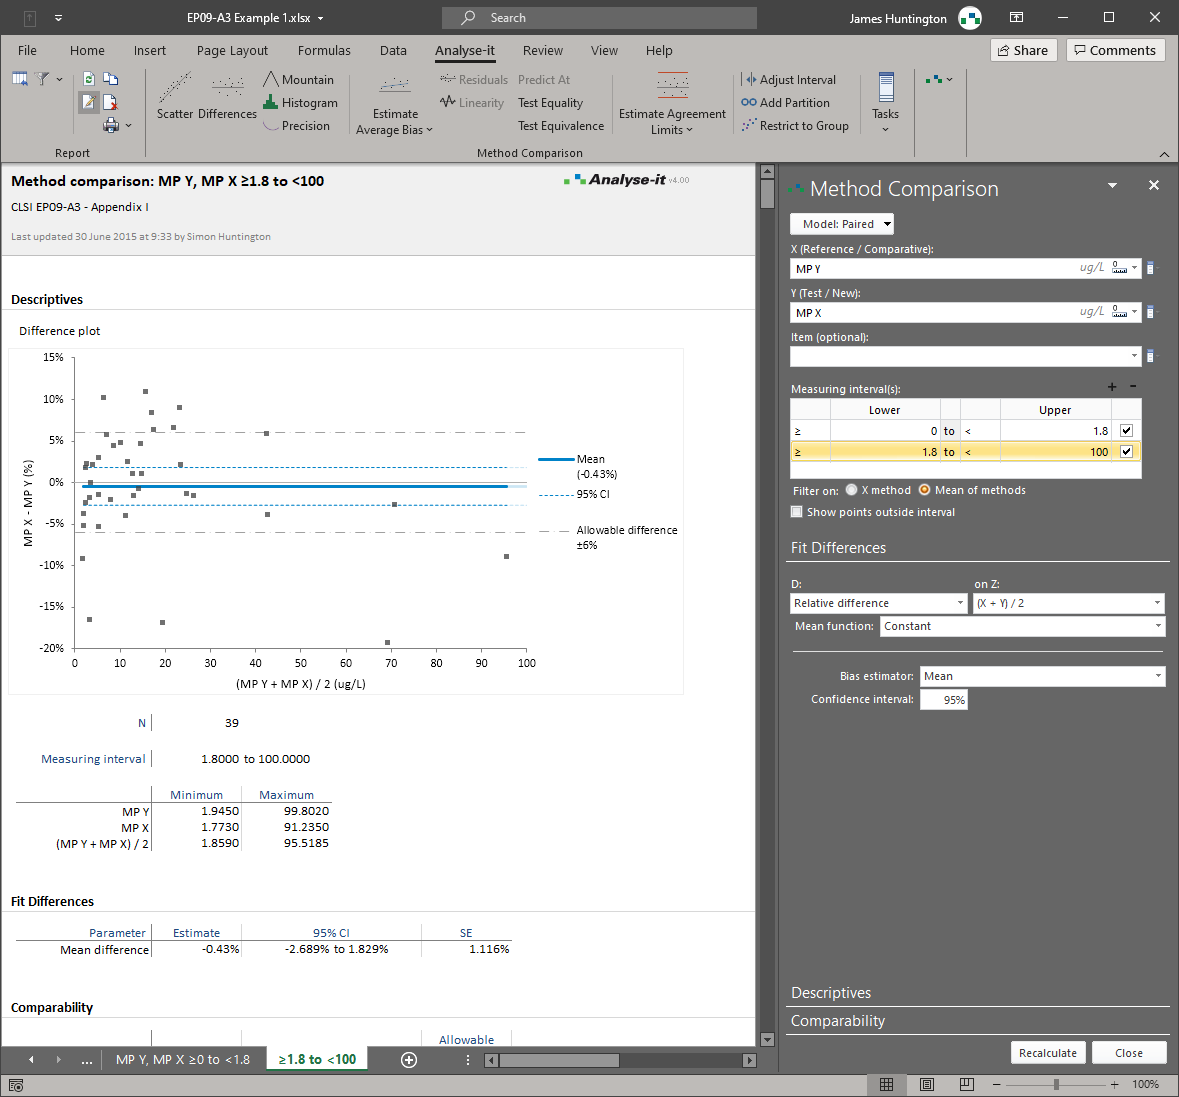
Assess agreement between measurement methods
Bland-Altman limits of agreement with mean or median bias, constant and non-constant precision, replicate support, and confidence intervals on the limits. Proportional bias detection. For evaluating whether a new measurement method can be used interchangeably with an existing one.
-
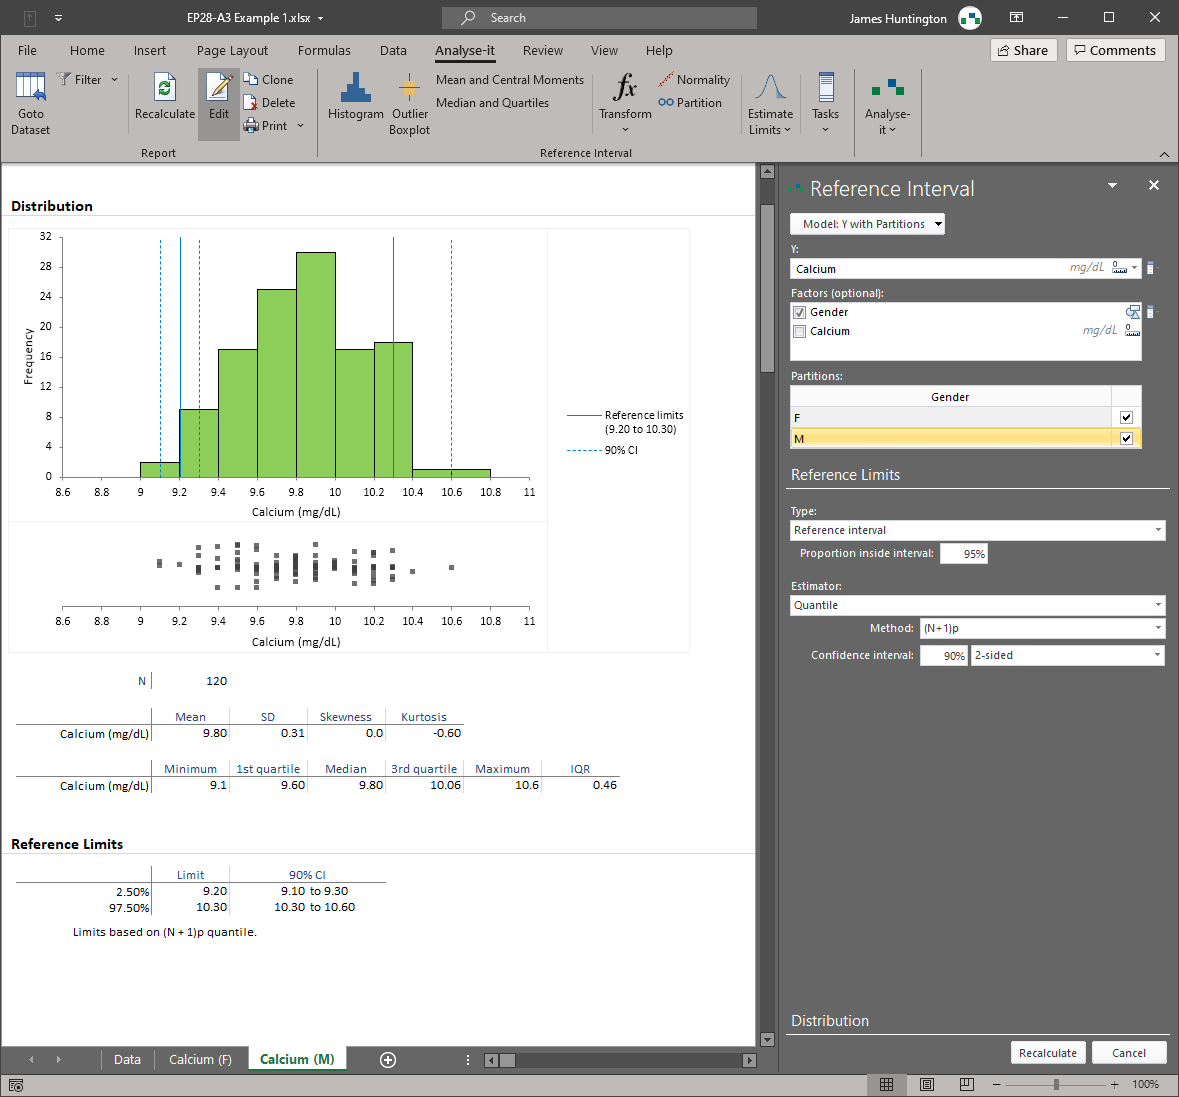
Establish reference intervals for your population
Parametric, non-parametric, robust, bootstrap, and Harrell-Davis quantile methods. Partition by sex, age, ethnicity, or any factor. Full range of transformations for non-normal data. Transfer and verify existing intervals against a new procedure or population.
-
Test hypotheses and compare groups
Student's t-tests, Wilcoxon, Mann-Whitney, ANOVA, Kruskal-Wallis, and Friedman tests. Nine multiple comparison procedures including Tukey-Kramer, Dunnett, and Scheffe. Contingency tables with Fisher exact, McNemar, and risk estimation. Proportion differences, ratios, and odds ratios with confidence intervals.
-
Fit regression models with full diagnostics
Simple and multiple linear regression, polynomial regression, ANOVA and ANCOVA with interaction terms. Residual plots, leverage, Cook's influence, and outlier identification. R-squared, adjusted R-squared, AIC, BIC. Predict new observations from the fitted model.
-
Defensible at peer review
Every calculation runs in Analyse-it's own validated engine — no Excel formulas or third-party functions. The numbers you report can be defended under reviewer scrutiny. See the development and validation process.
Trusted by 75,000 researchers, analysts, and scientists at leading universities, hospitals, and companies worldwide — for over 30 years.
Try free for 15 days