Process improvement software for quality teams Pareto analysis to find where problems concentrate, control charts to understand stability, hypothesis tests and regression to confirm root causes, and capability indices to verify improvements hold — the complete improvement workflow in one package.
Trusted by 75,000 researchers, analysts, and scientists at leading universities, hospitals, and companies worldwide — for over 30 years.
From problem to sustained improvement
Pareto analysis to identify where defects concentrate. Control charts to understand process stability. Hypothesis tests and regression to confirm root causes. Capability indices to measure the improvement. Control charts again to verify it holds. One package, one workbook.
Statistical proof that changes work
It is easy to see an improvement after a change and assume the change caused it. Hypothesis tests, regression models, and before-and-after capability comparisons distinguish real improvement from natural variation, seasonal effects, or coincidence.
Results everyone can read
Improvement work involves more than the analyst — operations managers, engineers, finance, and registrars all need to engage with the results. All charts and analyses stay in Excel workbooks that anyone in the organisation can open.
Most process improvement work stalls not because people lack ideas, but because they lack the statistical tools to properly diagnose the problem, confirm the root cause, and demonstrate that a change has made a genuine difference rather than just introducing a different pattern of variation. The tools that close those gaps — control charts, capability analysis, hypothesis tests, Pareto analysis — have traditionally required dedicated statistical packages with specialist training, expensive per-seat licences, and output in formats the rest of the organisation cannot easily read. That creates a bottleneck: the analysis depends on the one person with the licence and the training, and the results have to be re-presented before anyone else can engage with them.
Analyse-it removes that bottleneck. Control charts with WECO, Nelson, and Montgomery detection rules to establish whether the process is stable or driven by assignable causes. Pareto analysis with one-way and two-way comparative charts to identify where defects and failures concentrate — and to break them down by shift, operator, machine, or product line to see why. Hypothesis tests including t-tests, ANOVA, and non-parametric alternatives to confirm root causes statistically. Regression and ANCOVA to model the relationship between process inputs and outputs and predict the effect of proposed changes. Process capability indices — Cp, Cpk, Pp, Ppk, Cpm, Z-benchmark, and sigma level — to measure how much improvement has been achieved and whether the process now meets the specification.
The practical value is continuity across the improvement cycle. Identify the top defect category with Pareto. Set up a control chart to monitor it and confirm the process is stable. Run hypothesis tests to confirm the suspected root cause. Implement the change. Use phased control charts to compare before-and-after behaviour. Run capability analysis to quantify the improvement against the specification. All in the same workbook, all on the same data, all producing results that anyone in the organisation — from the shop floor to the operations director — can open without needing separate software.
75,000 professionals at leading companies, hospitals, and laboratories worldwide have relied on Analyse-it for over 30 years.
What's included
-
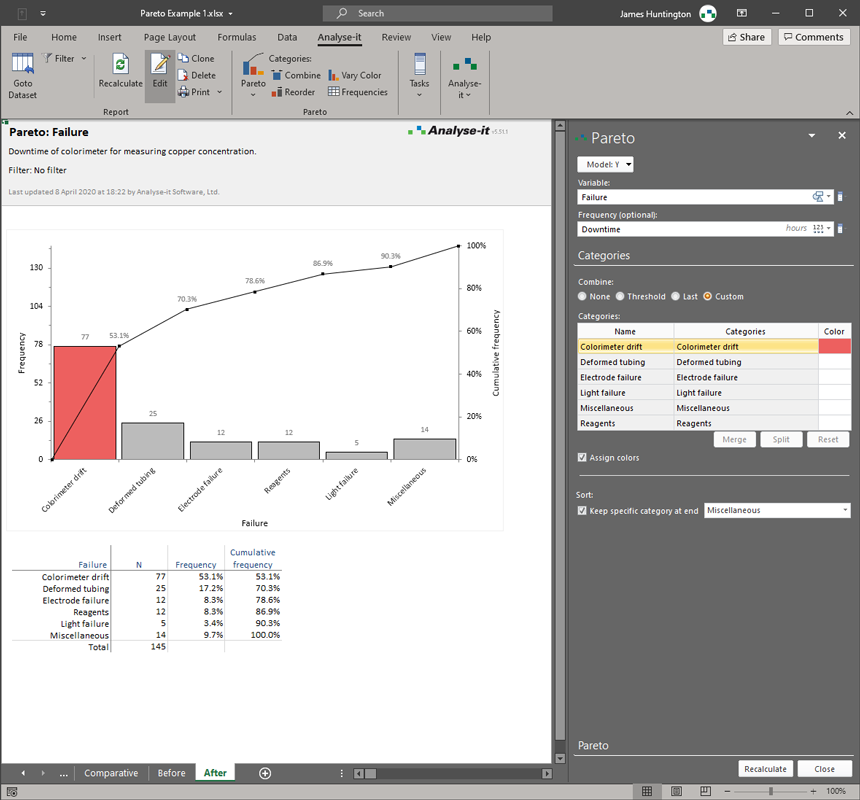
Find where problems concentrate
One-way and two-way comparative Pareto charts to identify the defect categories, failure modes, or complaint types that account for most problems. Break down by shift, operator, product line, or site to identify where the concentration lies. See Pareto analysis details.
-
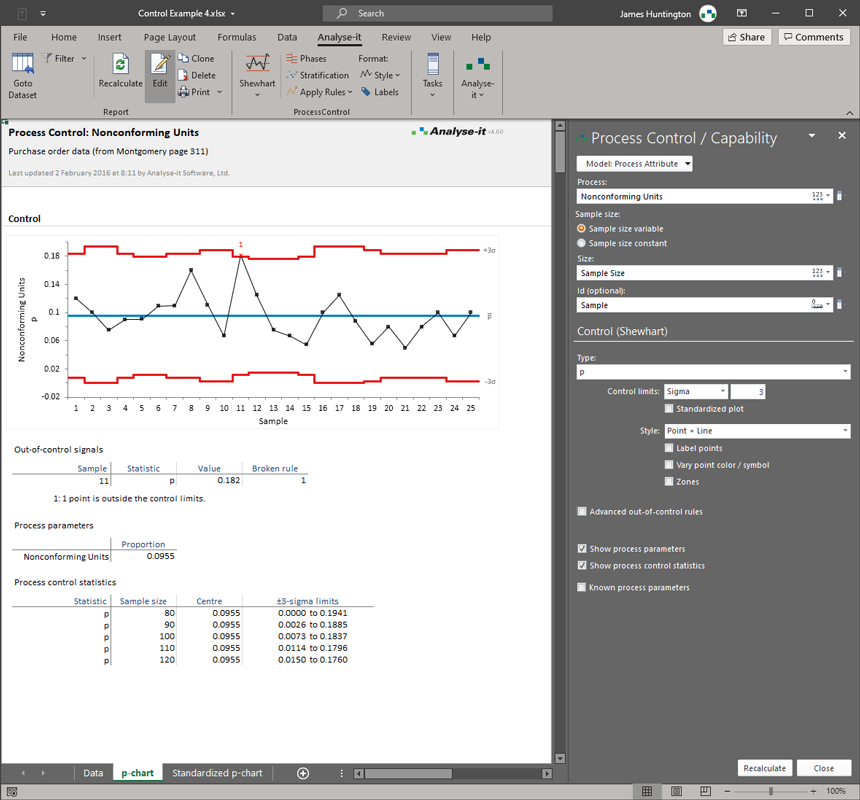
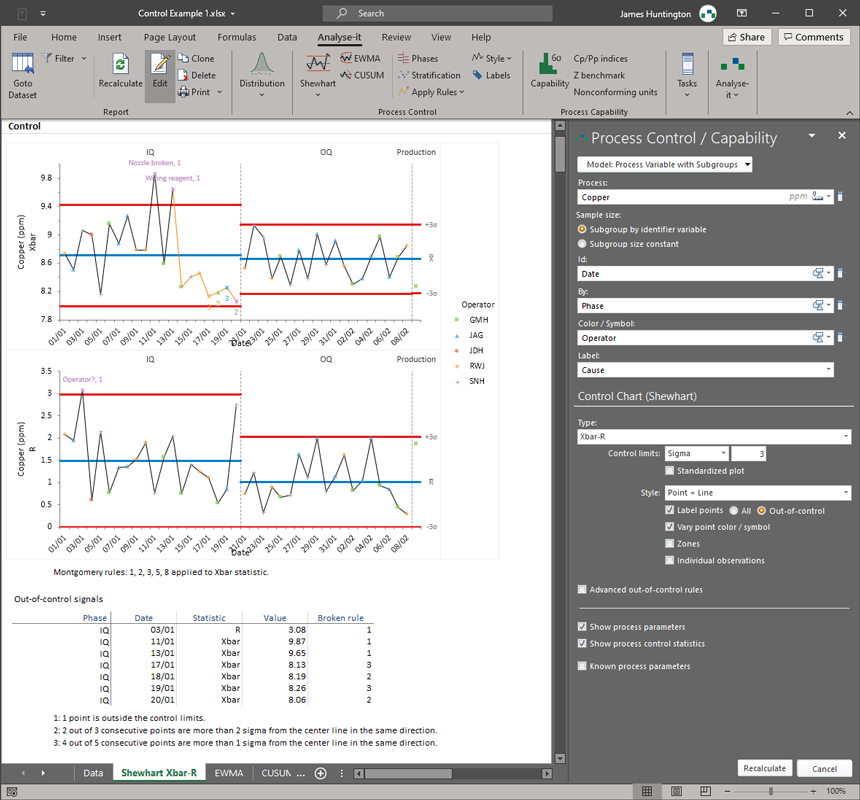
Understand whether the process is stable
Shewhart variable and attribute control charts, CUSUM and EWMA time-weighted charts. WECO, Nelson, and Montgomery detection rules flag assignable causes automatically. Phases for before-and-after comparison. Stratification by any factor. See control chart details.
-
Confirm root causes statistically
t-tests, ANOVA, Welch's ANOVA, and non-parametric alternatives for comparing groups or time periods. Chi-square and Fisher exact tests for categorical data. Multiple comparison procedures including Tukey-Kramer, Dunnett, and Hsu. Statistical proof that a root cause is real, not coincidence.
-
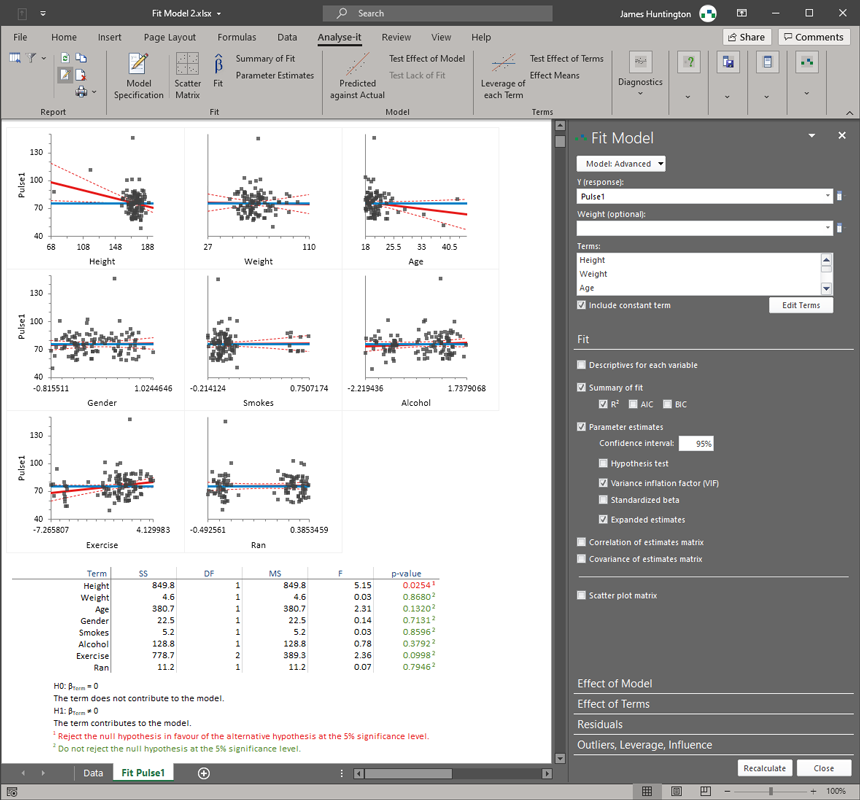
Model input-output relationships and predict effects
Simple and multiple linear regression, polynomial regression, ANOVA and ANCOVA with interactions. Full residual diagnostics, leverage plots, and influence analysis. Quantify which inputs have the most leverage on the outcome and predict the effect of proposed changes.
-
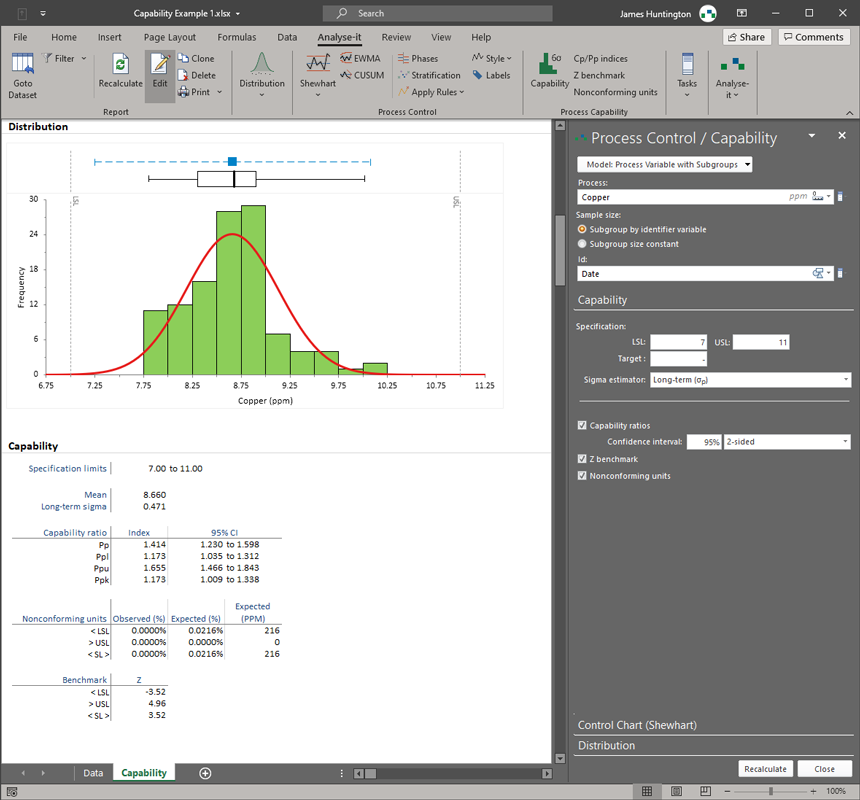
Measure improvement against the specification
Cp, Cpk, Pp, Ppk, Cpm, Z-benchmark, sigma level, and nonconforming unit estimation — before and after the improvement. Box-Cox transformations for non-normal data. Compare capability and performance indices to verify the improvement is real and sustained. See capability analysis details.
-
Part of the QC and Improvement edition
Every tool listed above is included in the QC and Improvement edition — the complete improvement workflow in one package, inside Excel, with results anyone in the organisation can open and share.
Trusted by 75,000 researchers, analysts, and scientists at leading universities, hospitals, and companies worldwide — for over 30 years.
Try free for 15 days