Statistics add-in software for statistical analysis in Excel
  • Tutorials
  • Compare groups means tutorial

Testing assumptions of the t-test

Many statistical tests have assumptions that must be true for the test results to be valid. A pooled sample t-test assumes that the samples are normally distributed and the variances of the groups are equal. It can be useful to verify the assumptions.

Note: Although this tutorial formally tests the assumptions of the t test, many statisticians would recommend against doing so because the t-test is fairly robust to departures from normality for moderate sample sizes. Also some homogeneity of variance tests can be extremely sensitive to departures of normality and may cause you to believe the variances are not equal.
  1. On the Analyse-it ribbon tab, in the Compare Groups group, click Test Normality.

    A Shapiro-Wilk normality test is added to the analysis task pane.

  2. On the Analyse-it ribbon tab, in the Compare Groups group, click Test Homogeneity of Variance, and then click Levene.

    A Levene test for variances is added to the analysis task pane.

  3. In the Significance level edit box, enter 5%.
  4. Click Recalculate.
    The results are recalculated and the analysis report updates.

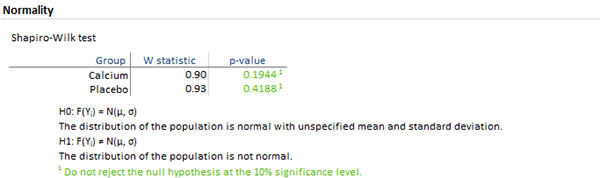
The p-value of the normality test is not significant so do not reject the null hypothesis. The data can be treated as normally distributed.

The p-value of the homogeneity of variance test is 0.04 so reject the null hypothesis of homogeneity of variances in favor of the alternative hypothesis of a difference in variances.

levene test

Next topic: Trying a different statistical test

  •  Tutorials
  •  Distribution tutorial
  •  Correlation / PCA tutorial
  •  Compare groups means tutorial
  •  Testing for a difference of means
  •  Testing assumptions of the t-test
  •  Trying a different statistical test
  •  Association in 2-way contingency tables tutorial
  •  Simple linear regression tutorial
  •  Bland-Altman method comparison tutorial
  •  Estimating the precision of a measurement procedure (CLSI EP05-A3)
  •  Evaluating the linearity of a measurement procedure (CLSI EP06-A)
  •  Verifying the precision of a measurement procedure against a performance claim and estimating the bias (CLSI EP15-A3)
  •  Pareto charts tutorial
  •  Process control charts tutorial
  •  Process capability tutorial


Version 6.15
Published 18-Apr-2023
statistics software, statistical software for Excel
  • Products
  • Store 
  • Support
  • Blog
  • About us
  • Download trial
  •  Search
  •  Sign in
  •  Contact us
Analyse-it editions
  • Standard edition
  • Medical edition
  • Method Validation edition
  • Quality Control & Improvement edition
  • Ultimate edition

  • Blog  
  • About us
  • Contact us  
  • Privacy policy


Copyright 2026 Analyse-it Software, Ltd, Leeds, United Kingdom .
We use essential cookies to run the site, and optional analytics to improve the experience for visitors. For more information see our Privacy policy.