Statistics add-in software for statistical analysis in Excel
  • Tutorials
  • Process capability tutorial

Determining process capability

To determine process capability it is important that the process is in statistical control. It is meaningless to characterize a process that is unpredictable.

  1. Open the file tutorials\Copper.xlsx.

    The worksheet is open and shows the data we used in the process control tutorial.

  2. On the worksheet, alongside the Phase column, click the drop-down arrow, then clear the IQ and Production check boxes, and select the OQ check-box, and click OK.

    The data is filtered to only the phase when the process was-in control is used.

  3. On the Analyse-it ribbon tab, in the Statistical Analyses group, click Capability, and then click 6-up.
    The analysis task pane opens.
  4. In the Process drop-down list, select Copper.
  5. In the Id drop-down list, select Date.
  6. In the LSL edit box, type 7.
  7. In the USL edit box, type 11.
  8. Select the Capability ratios and Nonconforming units check boxes.
  9. Click Calculate.
    The results are calculated and the analysis report opens.

The 6-up capability analysis shows the process control charts, a histogram of the distribution, a box-plot summary of the distribution, a mean +/- 3 sigma plot, and normal probability plot. Upper and lower specification limits show the specification.

Process capability indices
Based on the report you can see:
  • The process is in statistical control during the period.
  • The distribution is approximately Normal which is an assumption of most capability indices.
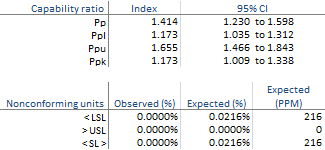
  • Ppk is 1.173 indicating the process is not capable meeting the specifications.
  • Pp is 1.414 indicating that if the process were centered between the specification limits it would just be acceptable.
  • It is expected the process will produce 216 non-conforming units per million.
Next topic: What's the difference between Pp and Cp?

  •  Tutorials
  •  Distribution tutorial
  •  Correlation / PCA tutorial
  •  Compare groups means tutorial
  •  Association in 2-way contingency tables tutorial
  •  Simple linear regression tutorial
  •  Bland-Altman method comparison tutorial
  •  Estimating the precision of a measurement procedure (CLSI EP05-A3)
  •  Evaluating the linearity of a measurement procedure (CLSI EP06-A)
  •  Verifying the precision of a measurement procedure against a performance claim and estimating the bias (CLSI EP15-A3)
  •  Pareto charts tutorial
  •  Process control charts tutorial
  •  Process capability tutorial
  •  Determining process capability
  •  What's the difference between Pp and Cp?


Version 6.15
Published 18-Apr-2023
statistics software, statistical software for Excel
  • Products
  • Store 
  • Support
  • Blog
  • About us
  • Download trial
  •  Search
  •  Sign in
  •  Contact us
Analyse-it editions
  • Standard edition
  • Medical edition
  • Method Validation edition
  • Quality Control & Improvement edition
  • Ultimate edition

  • Blog  
  • About us
  • Contact us  
  • Privacy policy


Copyright 2026 Analyse-it Software, Ltd, Leeds, United Kingdom .
We use essential cookies to run the site, and optional analytics to improve the experience for visitors. For more information see our Privacy policy.