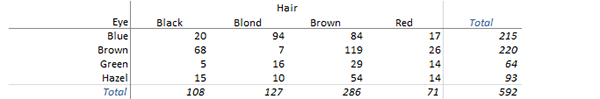
Cross tabulation of the data
When two variables are measured the relationship between them is often of interest. A contingency table describes the joint distribution of the variables. It can also describe the marginal distributions of each variable, or the conditional distribution of one variable given the other.
The contingency table shows the joint distribution of the variables.
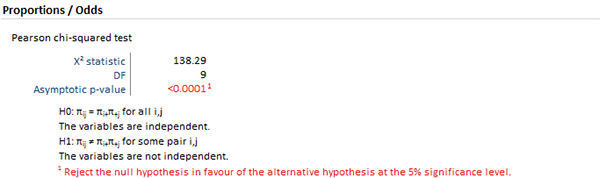
The hypothesis test p-value is highlighted as it is less than 5% significance level (the actual p-value is < 0.0001). You can interpret the p-value as indicating a substantial departure from independence.
Next topic: Displaying patterns of association