Statistics add-in software for statistical analysis in Excel
  • Tutorials
  • Association in 2-way contingency tables tutorial

Reordering data

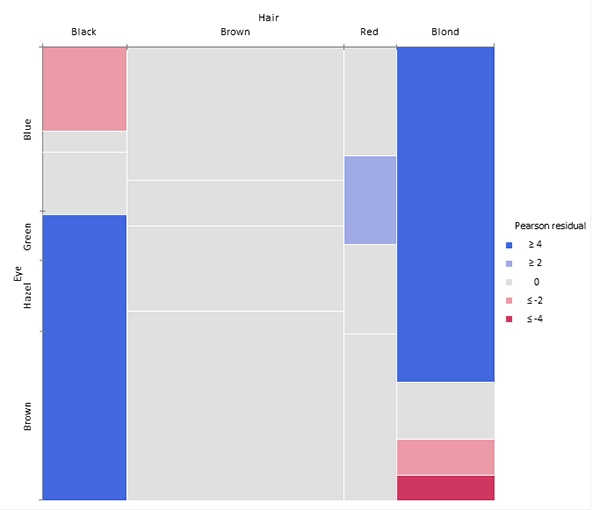
To increase the visual impact of the mosaic plot you can reorder the rows and columns to make the pattern more coherent. It is useful to re-order the categories so that the deviations from independence have opposite-corner pattern, with positive values running from bottom-left to top-right corners and negative values along the opposite diagonal.

  1. On the Analyse-it ribbon tab, in the Report group, click Goto Dataset.
  2. On the Analyse-it ribbon tab, in the Dataset group, click Dataset.
  3. In the Variables list box. select Hair.
  4. Clear Sort categories.
  5. In the Categories list, click and drag the categories to re-order them into the order: Black, Brown, Red, Blond.
  6. In the Variables list box, select Eye.
  7. Clear Sort categories.
  8. In the Categories list, click and drag the categories to re-order them into the order: Blue, Green, Hazel, Brown.
  9. Click Apply.
  10. Activate the report worksheet.
  11. On the Analyse-it ribbon tab, in the Report group, click Recalculate.

The over-representation of Black/Brown and Blond/Blue is now much more apparent, together with the under-representation of Blond/Brown and people with Black hair and Blue eyes. Although the table was reordered based on the residuals you can see that both dimensions are ordered from dark to light, suggesting an explanation for the association.

mosaic plot re-ordered

  •  Tutorials
  •  Distribution tutorial
  •  Correlation / PCA tutorial
  •  Compare groups means tutorial
  •  Association in 2-way contingency tables tutorial
  •  Cross tabulation of the data
  •  Displaying patterns of association
  •  Reordering data
  •  Simple linear regression tutorial
  •  Bland-Altman method comparison tutorial
  •  Estimating the precision of a measurement procedure (CLSI EP05-A3)
  •  Evaluating the linearity of a measurement procedure (CLSI EP06-A)
  •  Verifying the precision of a measurement procedure against a performance claim and estimating the bias (CLSI EP15-A3)
  •  Pareto charts tutorial
  •  Process control charts tutorial
  •  Process capability tutorial


Version 6.15
Published 18-Apr-2023
statistics software, statistical software for Excel
  • Products
  • Store 
  • Support
  • Blog
  • About us
  • Download trial
  •  Search
  •  Sign in
  •  Contact us
Analyse-it editions
  • Standard edition
  • Medical edition
  • Method Validation edition
  • Quality Control & Improvement edition
  • Ultimate edition

  • Blog  
  • About us
  • Contact us  
  • Privacy policy


Copyright 2026 Analyse-it Software, Ltd, Leeds, United Kingdom .
We use essential cookies to run the site, and optional analytics to improve the experience for visitors. For more information see our Privacy policy.