Analyse-it
Analyse-it
  • Products
  • Pricing
  • Support
  • About us
Download trial Sign in
  • Tutorials
  • Bland-Altman method comparison tutorial

Dealing with a relationship between difference and magnitude of measurement

The difference plot may sometimes suggest a relationship between the differences and magnitude of measurement. Often, the band of points on the difference plot will start narrow and then widen to the right of the plot as magnitude increases. This indicates that the variability of the differences increases with magnitude of measurement. Sometimes, the band of points may not be horizontal, which indicates a relationship between average difference and the magnitude.

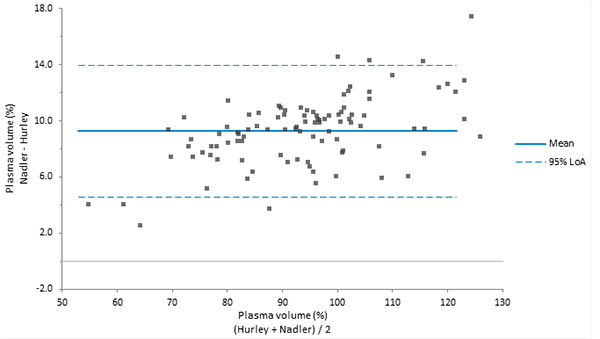
To illustrate these concepts, we will use an example from Bland & Altman’s 1999 paper. This example measures plasma volume expressed as a percentage of normal using two alternative sets of normal values from Nadler and Hurley.

  1. Open the file tutorials\Plasma.xlsx.
  2. Click a cell in the dataset.
  3. On the Analyse-it ribbon tab, in the Statistical Analyses group, click Method Comparison, and then click Bland-Altman.
    The analysis task pane opens.
  4. In the Model drop-down list, click Matched Pairs to indicate the layout of the data.
  5. In the Y variable drop-down list, select Plasma volume.
  6. In the Item variable drop-down list, select Subject.
  7. In the Method variable drop-down list, select Method.
  8. Click Calculate.
    The results are calculated and the analysis report opens.

The difference plot shows an obvious systematic difference between the methods as all the differences are above the line of equality (zero). There is also a clear relationship between the difference and the mean, with the difference increasing as plasma volume rises. The limits of agreement appear rather wide at low values and too narrow at higher values.

Next topic: Transforming the measurements to remove a relationship between differences and magnitude

  •  Tutorials
  •  Distribution tutorial
  •  Correlation / PCA tutorial
  •  Compare groups means tutorial
  •  Association in 2-way contingency tables tutorial
  •  Simple linear regression tutorial
  •  Bland-Altman method comparison tutorial
  •  Plotting the relationship between methods
  •  Estimating the average bias and the limits of agreement
  •  Understanding the importance of repeatability
  •  Using repeated measurements
  •  Dealing with a relationship between difference and magnitude of measurement
  •  Transforming the measurements to remove a relationship between differences and magnitude
  •  Estimating regression based limits of agreement when transformation is not enough
  •  Estimating nonparametric limits of agreement in non-normally distributed data
  •  Estimating the precision of a measurement procedure (CLSI EP05-A3)
  •  Evaluating the linearity of a measurement procedure (CLSI EP06-A)
  •  Verifying the precision of a measurement procedure against a performance claim and estimating the bias (CLSI EP15-A3)
  •  Pareto charts tutorial
  •  Process control charts tutorial
  •  Process capability tutorial


Version 6.15
Published 18-Apr-2023
Products
  • Standard Edition
  • Medical Edition
  • Quality Control & Improvement Edition
  • Method Validation Edition
  • Ultimate Edition
  • Compare Editions
  • Pricing
Support
  • Documentation
  • Tutorials
  • Download latest version
  • Release history
  • Contact support
Company
  • About us
  • Blog
  • Contact us
  • Privacy policy

Get Started

  • Download free trial
  • Sign In

© 2026 Analyse-it® Software, Ltd. All rights reserved.

Statistical analysis and method validation software for Microsoft Excel.

We use essential cookies to run the site, and optional analytics to improve the experience for visitors. For more information see our Privacy policy.