Statistics add-in software for statistical analysis in Excel
  • Tutorials
  • Bland-Altman method comparison tutorial

Understanding the importance of repeatability

Repeatability — or variation in repeated measurements on the same subject under identical conditions over a short period of time — is important because it directly affects the agreement between methods. To assess repeatability, two or more measurements by each method on each subject must be made.

If one method has poor repeatability, the agreement between the two methods will also be poor. If both methods have poor repeatability, the agreement will be even worse. When comparing agreement with an old method with poor repeatability, even a perfect new method will not agree with it.

  1. On the Analyse-it ribbon tab, in the Method Comparison group, click Precision.
  2. Click Recalculate.
    The results are recalculated and the analysis report updates.

The repeatability plots show the standard deviation (SD) of the measurements for each subject and method. Larger values indicate poor agreement between replicate measurements. Based on the plots, the repeatability of both methods is similar and the SD is not related to the magnitude of the measurement.

repeatability plot

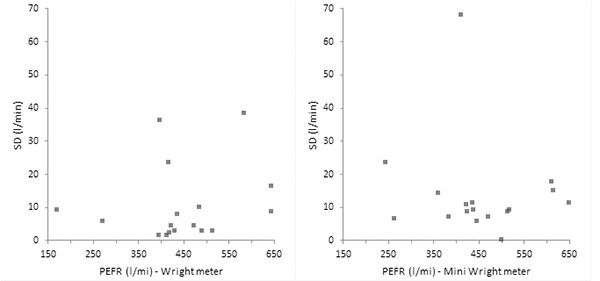
The coefficient of repeatability is 42.4 for the Wright meter and 55.2 for the Mini Wright meter. Therefore, 95% of differences between repeated measurements made with the Wright meter are expected to be within 42.4 l/min and similarly 55.2 l/min for the Mini Wright meter.

Next topic: Using repeated measurements

  •  Tutorials
  •  Distribution tutorial
  •  Correlation / PCA tutorial
  •  Compare groups means tutorial
  •  Association in 2-way contingency tables tutorial
  •  Simple linear regression tutorial
  •  Bland-Altman method comparison tutorial
  •  Plotting the relationship between methods
  •  Estimating the average bias and the limits of agreement
  •  Understanding the importance of repeatability
  •  Using repeated measurements
  •  Dealing with a relationship between difference and magnitude of measurement
  •  Transforming the measurements to remove a relationship between differences and magnitude
  •  Estimating regression based limits of agreement when transformation is not enough
  •  Estimating nonparametric limits of agreement in non-normally distributed data
  •  Estimating the precision of a measurement procedure (CLSI EP05-A3)
  •  Evaluating the linearity of a measurement procedure (CLSI EP06-A)
  •  Verifying the precision of a measurement procedure against a performance claim and estimating the bias (CLSI EP15-A3)
  •  Pareto charts tutorial
  •  Process control charts tutorial
  •  Process capability tutorial


Version 6.15
Published 18-Apr-2023
statistics software, statistical software for Excel
  • Products
  • Store 
  • Support
  • Blog
  • About us
  • Download trial
  •  Search
  •  Sign in
  •  Contact us
Analyse-it editions
  • Standard edition
  • Medical edition
  • Method Validation edition
  • Quality Control & Improvement edition
  • Ultimate edition

  • Blog  
  • About us
  • Contact us  
  • Privacy policy


Copyright 2026 Analyse-it Software, Ltd, Leeds, United Kingdom .
We use essential cookies to run the site, and optional analytics to improve the experience for visitors. For more information see our Privacy policy.