Analyse-it
Analyse-it
  • Products
  • Pricing
  • Support
  • About us
Download trial Sign in
  • Tutorials
  • Bland-Altman method comparison tutorial

Plotting the relationship between methods

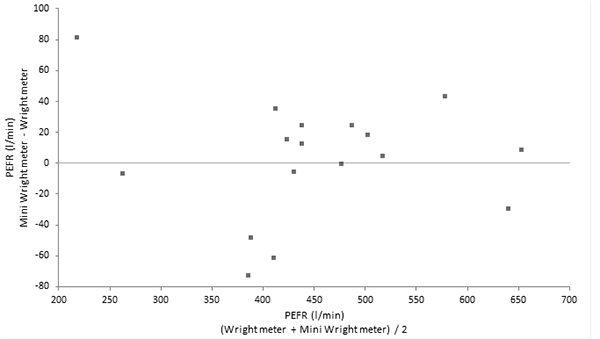
When assessing the agreement between two methods, it is useful to the plot the difference between methods against the mean of the methods (a difference plot).

A difference plot is, effectively, a scatter plot rotated 45 degrees clockwise. However, a difference plot is more informative than a scatter plot since the data points are not tightly clustered around the diagonal. A difference plot also clearly shows any relationship between the differences and the magnitude of measurement.

To illustrate this concept, we will use an example from Bland & Altman’s 1986 paper. This example compares two methods of measuring peak expiratory flow rate (PEFR). On each of 17 subjects, two measurements were taken with a Wright meter, and two with a mini Wright meter.

  1. Open the file tutorials\PEFR.xlsx.
  2. Click a cell in the dataset.
  3. On the Analyse-it ribbon tab, in the Statistical Analyses group, click Agreement / Method Comparison, and then click Difference plot.
    The analysis task pane opens.
  4. In the X variable drop-down list, select Wright meter.
  5. In the Y variable drop-down list, select Mini Wright meter.
  6. Select the 1st replicate option.

    Per Bland & Altman‘s paper, only the first measurement (replicate) by each method is used to illustrate the difference plot and limits of agreement. Both measurements (replicates) are used in the study of repeatability.

  7. Click Calculate.
    The results are calculated and the analysis report opens.

The points on the difference plot roughly form a constant width horizontal band across the measuring interval, and there is no obvious relationship between the difference and the mean or the variability of the measurements and the mean.

Next topic: Estimating the average bias and the limits of agreement

  •  Tutorials
  •  Distribution tutorial
  •  Correlation / PCA tutorial
  •  Compare groups means tutorial
  •  Association in 2-way contingency tables tutorial
  •  Simple linear regression tutorial
  •  Bland-Altman method comparison tutorial
  •  Plotting the relationship between methods
  •  Estimating the average bias and the limits of agreement
  •  Understanding the importance of repeatability
  •  Using repeated measurements
  •  Dealing with a relationship between difference and magnitude of measurement
  •  Transforming the measurements to remove a relationship between differences and magnitude
  •  Estimating regression based limits of agreement when transformation is not enough
  •  Estimating nonparametric limits of agreement in non-normally distributed data
  •  Estimating the precision of a measurement procedure (CLSI EP05-A3)
  •  Evaluating the linearity of a measurement procedure (CLSI EP06-A)
  •  Verifying the precision of a measurement procedure against a performance claim and estimating the bias (CLSI EP15-A3)
  •  Pareto charts tutorial
  •  Process control charts tutorial
  •  Process capability tutorial


Version 6.15
Published 18-Apr-2023
Products
  • Standard Edition
  • Medical Edition
  • Quality Control & Improvement Edition
  • Method Validation Edition
  • Ultimate Edition
  • Compare Editions
  • Pricing
Support
  • Documentation
  • Tutorials
  • Download latest version
  • Release history
  • Contact support
Company
  • About us
  • Blog
  • Contact us
  • Privacy policy
Copyright 2026 Analyse-it Software, Ltd.
Statistical analysis and method validation software for Microsoft Excel.
We use essential cookies to run the site, and optional analytics to improve the experience for visitors. For more information see our Privacy policy.