Reducing the measuring interval
Reduce the measuring interval to find the interval where the fit is linear.
Sometimes it is possible to reduce the measuring interval to a smaller range that is still useful.
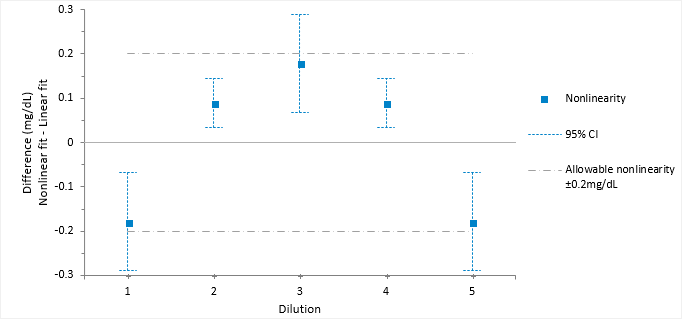
The linearity plot differences now lie within the allowable nonlinearity of 0.2 mg/dL. Therefore, the method is declared as linear within 0.2mg/dL between the reduced interval 4.65 and 15.4 mg/dL.