- Tutorials
- Verifying the precision of a measurement procedure against a performance claim and estimating the bias (CLSI EP15-A3)
Estimating bias
Estimate the bias using reference materials.
You should use this procedure when you already have a sample with a known assigned value and you want to estimate the bias and test whether it is significantly different to zero. It is possible for the bias from a study to be greater than zero due to the chance alone. This procedure ensures that the assumption that the bias is 0 is only falsely rejected 5% of the time when it is in fact true.
-
On the Analyse-it ribbon tab, in the MSA group, click Test Equality.
The Trueness panel opens.
-
In the Assigned values grid, in the Values column type the known values of the materials.
ID Value 1 25.0 2 142.5 3 650 Note: CLSI EP15-A3 only gives the assigned value for Sample 2. We have fabricated values for the other samples for demonstration purposes. -
Select the Uncertainty in assigned values check box, and then in the Assigned values grid, alongside sample 2, in the SE column type 0.69 and in the DF column type 42.
The standard error (SE) of the assigned value depends on the source of the assigned value. Reference materials usually are accompanied by a standard uncertainty, whereas proficiency testing materials usually specify the SD and number of laboratories. The standard error (SE) should be computed using the formula in the CLSI document. The degrees of freedom (DF) is usually only used when the sample is PT material and is equal to the number of laboratories minus 1.
-
In the Significance level edit box, type 5% and select the Familywise error rate check box.
CLSI EP15-A3 uses a familywise significance level so the overall significance level is a maximum of 5% regardless of the number of comparisons (for example, for 1 level the significance level is 5%, for 2 levels the significance level is 5%/2 = 2.5% for each level, for 3 levels the significance level is 5%/3 = 1.6% for each level).
-
Click Recalculate.
The analysis report updates.
The table shows the observed and expected value along with the bias and the hypothesis test p-value for each level.
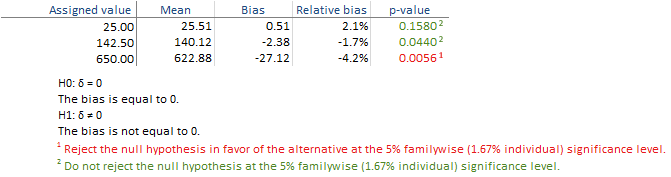
The hypothesis tests for level 1 and 2 are not significant in this example, but for level 3 the bias is significantly different from zero and is highlighted in red. You should therefore determine if the bias is acceptable for your laboratories needs by comparing it to user-specified allowable bias, or contact the manufacturer for further assistant in diagnosing the problem. If the hypothesis test is not statistically significant but the bias estimate is much larger than zero, you may want to repeat the study with more data to be able to detect smaller departures from the zero.