Statistics add-in software for statistical analysis in Excel
  • Tutorials
  • Verifying the precision of a measurement procedure against a performance claim and estimating the bias (CLSI EP15-A3)

Identifying and excluding outliers

Dealing with outliers and assessing their impact.

Even after correcting or excluding all result known to be spurious, there may sometimes be results marked as statistical outliers. This may be due to a nonperformance-related cause, which, if known, would have justified excluding the result. Alternatively, the apparently extreme results may genuinely represent the performance. There is always a trade-off between retaining the result which will inflate the imprecision estimates, or exclude it which may overly optimistic estimates. It is often good practice to calculate the results before and after excluding the outlier.

  1. On the Analyse-it ribbon tab, in the Report group, click Clone.

    The dataset worksheet activates and the analysis task pane remains open.

  2. On the Descriptives panel, select the Exclude identified outliers check box.
  3. On the analysis task pane, click Calculate.

    A new analysis report open.

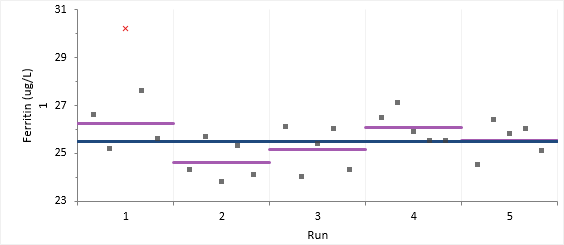
The variability plot show the excluded observation as a red cross.


EP15 variability plot with outlier

The detailed variance components table shows the observed and expected SD/CV along with the hypothesis test p-value for each level.

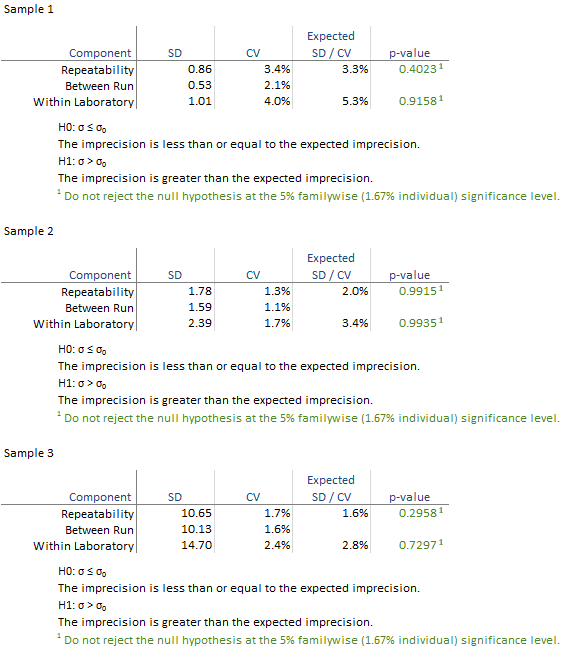
All the hypothesis tests are not significant and highlighted green. Because the exclusion of the outlier changes the outcome of the study it is essential to assess the clinical effect of the outlier and investigate further to try and determine its cause, or contact the manufacturer for further assistance in diagnosing the problem.

Next topic: Estimating bias

  •  Tutorials
  •  Distribution tutorial
  •  Correlation / PCA tutorial
  •  Compare groups means tutorial
  •  Association in 2-way contingency tables tutorial
  •  Simple linear regression tutorial
  •  Bland-Altman method comparison tutorial
  •  Estimating the precision of a measurement procedure (CLSI EP05-A3)
  •  Evaluating the linearity of a measurement procedure (CLSI EP06-A)
  •  Verifying the precision of a measurement procedure against a performance claim and estimating the bias (CLSI EP15-A3)
  •  Estimating precision
  •  Testing precision against a performance claim
  •  Identifying and excluding outliers
  •  Estimating bias
  •  Pareto charts tutorial
  •  Process control charts tutorial
  •  Process capability tutorial


Version 6.15
Published 18-Apr-2023
statistics software, statistical software for Excel
  • Products
  • Store 
  • Support
  • Blog
  • About us
  • Download trial
  •  Search
  •  Sign in
  •  Contact us
Analyse-it editions
  • Standard edition
  • Medical edition
  • Method Validation edition
  • Quality Control & Improvement edition
  • Ultimate edition

  • Blog  
  • About us
  • Contact us  
  • Privacy policy


Copyright 2026 Analyse-it Software, Ltd, Leeds, United Kingdom .
We use essential cookies to run the site, and optional analytics to improve the experience for visitors. For more information see our Privacy policy.