Statistics add-in software for statistical analysis in Excel
  • Tutorials
  • Verifying the precision of a measurement procedure against a performance claim and estimating the bias (CLSI EP15-A3)

Testing precision against a performance claim

Test if the precision meets the manufacturer's performance claim.

You should use this procedure when you already have a performance claim from a manufacturer's package insert and you want to test whether your precision is significantly greater than the claim. It is possible for the imprecision from a study to be greater than the manufacturer's claim due to the chance alone. This procedure ensures that the manufacturer's claims are only falsely rejected 5% of the time when they are in fact true.

  1. On the Analyse-it ribbon tab, in the Precision group, click Test Claim.
    The hypothesis test section on the Precision panel opens.
  2. In the Hypotheses grid, under the Repeatability SD/CV column, type the performance claims as an absolute value (for example, type 5 for a SD of 5 mg/dL) or relative value (for example, type 5% for a CV of 5%).
    Level Repeatability CV
    1 3.3%
    2 2.0%
    3 1.6%
  3. In the Hypotheses grid, under the Laboratory SD/CV column type the performance claims as an absolute(for example, type 5 for a SD of 5 mg/dL) or relative value (for example, type 5% for a CV of 5%).
    Level Laboratory CV
    1 5.3%
    2 3.4%
    3 2.8%
  4. In the Significance level edit box, type 5%, and then select the Familywise error rate check box.

    CLSI EP15 uses a familywise significance level so the overall significance level is a maximum of 5% regardless of the number of levels (for example, for 1 level the significance level is 5%, for 2 levels the significance level is 5%/2 = 2.5% for each level, for 3 levels the significance level is 5%/3 = 1.6% for each level).

  5. Click Recalculate.

    The analysis report updates.

The detailed variance components table shows the observed and expected SD/CV along with the hypothesis test p-value for each level.

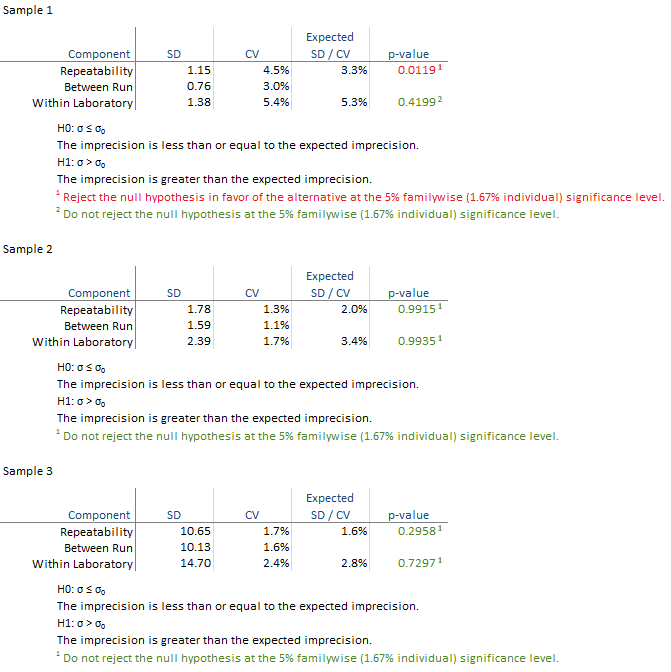
All the hypothesis tests are not significant and highlighted green in this example. If any are significant they are highlighted in red and you should contact the manufacturer for further assistance in diagnosing the problem. If the hypothesis test is not statistically significant but the imprecision estimate is much larger than the claim, you may want to repeat the study with more data to be able to detect smaller departures from the claim.

Next topic: Identifying and excluding outliers

  •  Tutorials
  •  Distribution tutorial
  •  Correlation / PCA tutorial
  •  Compare groups means tutorial
  •  Association in 2-way contingency tables tutorial
  •  Simple linear regression tutorial
  •  Bland-Altman method comparison tutorial
  •  Estimating the precision of a measurement procedure (CLSI EP05-A3)
  •  Evaluating the linearity of a measurement procedure (CLSI EP06-A)
  •  Verifying the precision of a measurement procedure against a performance claim and estimating the bias (CLSI EP15-A3)
  •  Estimating precision
  •  Testing precision against a performance claim
  •  Identifying and excluding outliers
  •  Estimating bias
  •  Pareto charts tutorial
  •  Process control charts tutorial
  •  Process capability tutorial


Version 6.15
Published 18-Apr-2023
statistics software, statistical software for Excel
  • Products
  • Store 
  • Support
  • Blog
  • About us
  • Download trial
  •  Search
  •  Sign in
  •  Contact us
Analyse-it editions
  • Standard edition
  • Medical edition
  • Method Validation edition
  • Quality Control & Improvement edition
  • Ultimate edition

  • Blog  
  • About us
  • Contact us  
  • Privacy policy


Copyright 2026 Analyse-it Software, Ltd, Leeds, United Kingdom .
We use essential cookies to run the site, and optional analytics to improve the experience for visitors. For more information see our Privacy policy.