Statistics add-in software for statistical analysis in Excel
  • Tutorials
  • Verifying the precision of a measurement procedure against a performance claim and estimating the bias (CLSI EP15-A3)

Estimating precision

Estimate the precision of the measurement procedure.

  1. Open the file tutorials\EP15-A3.xlsx.

    The worksheet opens showing 3 columns. The Sample column identifies the levels of the analyte in the sample (3 levels). Run identifies the day number of each run (5 runs). Ferritin (ug/L) identifies the measured value for 3 replicates of sample in each run.

  2. Click a cell in the dataset.
  3. On the Analyse-it ribbon tab, in the Statistical Analyses group, click Precision drop-down, and then click 1 Factor.
    The analysis task pane opens.
  4. In the Y drop-down list, select Ferritin.
  5. In the Factor A drop-down list, select Run.
  6. In the By drop-down list, select Sample.
  7. In the Estimator drop-down list, select SD.
  8. Clear the Detailed components check box.
  9. On the Analyse-it ribbon tab, in the MSA group, click Variability plot.
  10. On the Analyse-it ribbon tab, in the MSA group, click Identify Outliers.
  11. Click Calculate.

    The analysis report opens.

The variability plots show a simple visual assessment of the closeness of agreement between the measured quantity values. The purple lines show the mean of each run and the blue line the overall grand mean, allowing you to see the variation between and within each run.
EP15 variability plot

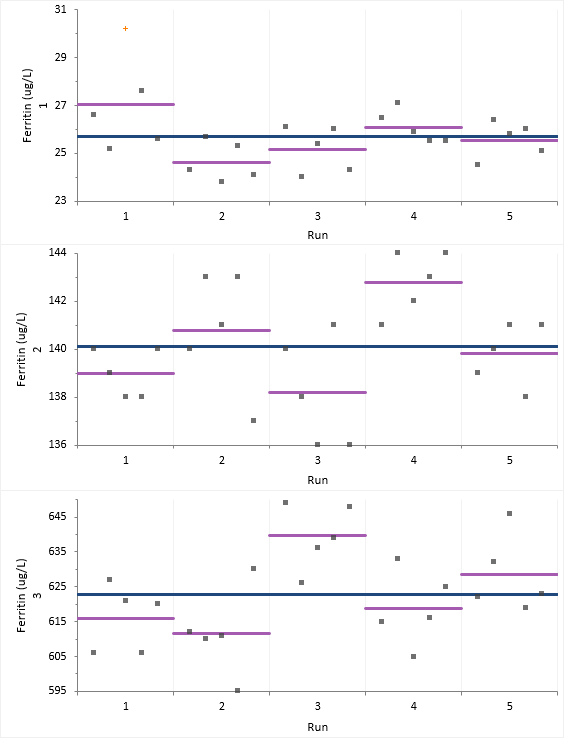
You should observe the scatter of the points to ensure there are no obvious problems. If a result appears spurious then you should investigate and correct any mistakes. If the data appear to be unusable, stop the evaluation and begin an expanded evaluation of the sources of measurement error or contact the manufacturer. We note that one observation in Sample 1, Run 1 is highlighted as a potential outlier but do not know the reason for the aberrant result. We will continue with this observation included in the analysis and return to it later.

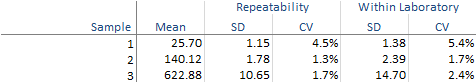
The abbreviated variance components table shows precision expressed numerically as the standard deviation (SD) and coefficient of variation (CV).
EP15 abbreviated components when failing goal

Next topic: Testing precision against a performance claim

  •  Tutorials
  •  Distribution tutorial
  •  Correlation / PCA tutorial
  •  Compare groups means tutorial
  •  Association in 2-way contingency tables tutorial
  •  Simple linear regression tutorial
  •  Bland-Altman method comparison tutorial
  •  Estimating the precision of a measurement procedure (CLSI EP05-A3)
  •  Evaluating the linearity of a measurement procedure (CLSI EP06-A)
  •  Verifying the precision of a measurement procedure against a performance claim and estimating the bias (CLSI EP15-A3)
  •  Estimating precision
  •  Testing precision against a performance claim
  •  Identifying and excluding outliers
  •  Estimating bias
  •  Pareto charts tutorial
  •  Process control charts tutorial
  •  Process capability tutorial


Version 6.15
Published 18-Apr-2023
statistics software, statistical software for Excel
  • Products
  • Store 
  • Support
  • Blog
  • About us
  • Download trial
  •  Search
  •  Sign in
  •  Contact us
Analyse-it editions
  • Standard edition
  • Medical edition
  • Method Validation edition
  • Quality Control & Improvement edition
  • Ultimate edition

  • Blog  
  • About us
  • Contact us  
  • Privacy policy


Copyright 2026 Analyse-it Software, Ltd, Leeds, United Kingdom .
We use essential cookies to run the site, and optional analytics to improve the experience for visitors. For more information see our Privacy policy.