
Changing the regression fit
After fitting a model and looking at the diagnostics you might reconsider some decisions. Often you may want to reformulate the model by changing the fit, or by adding, removing, or applying transformations to the variables.
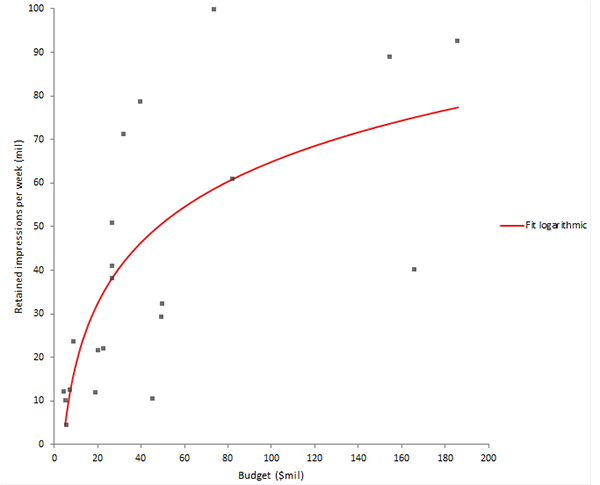
The scatter plot suggests the logarithmic model fits quite well and better describes the relationship than a quadratic model. The influence plot shows there are no outliers or highly influential plots.
Next topic: Making predictions