
Fitting a simple regression model
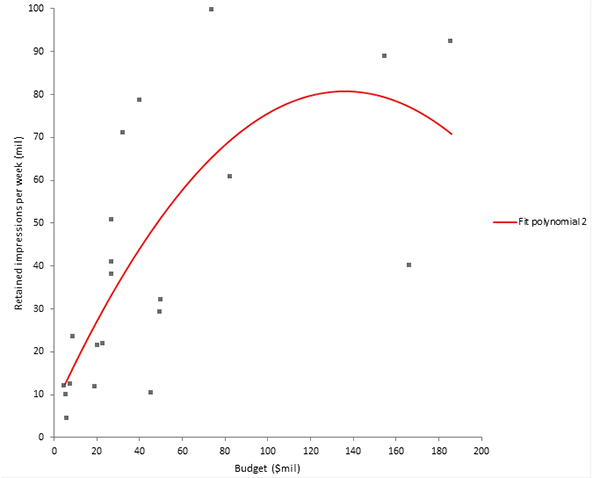
After inspecting the scatter plot the next step is to fit a model to describe the relationship.
The regression line on the scatter plot shows the relationship described by the model.
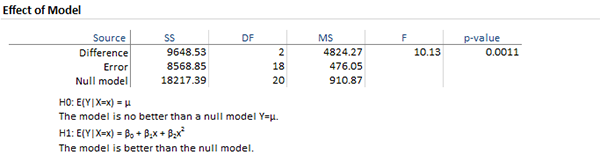
The effect of model table p-value of 0.0011 tells you that there is a statistically significant relationship between spend and yield.
Next topic: Checking the assumptions of the regression model