Statistics add-in software for statistical analysis in Excel
  • Tutorials
  • Simple linear regression tutorial

Checking the assumptions of the regression model

Most statistical methods have assumptions that should be true for the results to be valid. In ordinary least squares linear regression the following assumptions must be true:
  • There is a linear relationship between the predictor and response variables.
  • The error term has the same variance in each observation.
  • The errors are uncorrelated between observations.
  • The errors are normally distributed.
It is also important to consider influential observations that if removed would substantially change the model fit.
  1. On the Analyse-it ribbon tab, in the Diagnostics group, click Residuals > 3-up Plot.

    A residual plot with histogram and normal probability plot of the residuals are added to the analysis task pane.

  2. On the Analyse-it ribbon tab, in the Diagnostics group, click Outliers and Influence.

    An influence plot is added to the analysis task pane.

  3. Click Recalculate.
    The results are calculated and the analysis report opens.

The residual plot and normality plot show that the assumptions do not seem to be seriously violated.

However the influence plot shows that McDonald's has a large influence on the fit.

fit model regression influence plot

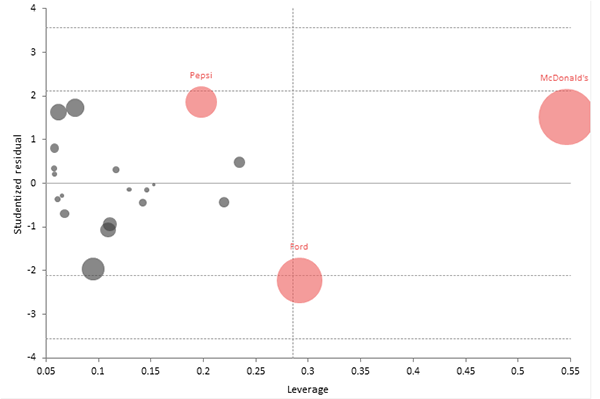
Looking again at the scatter plot and fit shows there is a downturn in the fitted line, compared to the data, as the spend increases. It might be worth considering alternative models to better describe the relationship.

Next topic: Changing the regression fit

  •  Tutorials
  •  Distribution tutorial
  •  Correlation / PCA tutorial
  •  Compare groups means tutorial
  •  Association in 2-way contingency tables tutorial
  •  Simple linear regression tutorial
  •  Plotting bivariate data
  •  Fitting a simple regression model
  •  Checking the assumptions of the regression model
  •  Changing the regression fit
  •  Making predictions
  •  Bland-Altman method comparison tutorial
  •  Estimating the precision of a measurement procedure (CLSI EP05-A3)
  •  Evaluating the linearity of a measurement procedure (CLSI EP06-A)
  •  Verifying the precision of a measurement procedure against a performance claim and estimating the bias (CLSI EP15-A3)
  •  Pareto charts tutorial
  •  Process control charts tutorial
  •  Process capability tutorial


Version 6.15
Published 18-Apr-2023
statistics software, statistical software for Excel
  • Products
  • Store 
  • Support
  • Blog
  • About us
  • Download trial
  •  Search
  •  Sign in
  •  Contact us
Analyse-it editions
  • Standard edition
  • Medical edition
  • Method Validation edition
  • Quality Control & Improvement edition
  • Ultimate edition

  • Blog  
  • About us
  • Contact us  
  • Privacy policy


Copyright 2026 Analyse-it Software, Ltd, Leeds, United Kingdom .
We use essential cookies to run the site, and optional analytics to improve the experience for visitors. For more information see our Privacy policy.