Statistics add-in software for statistical analysis in Excel
  • Tutorials
  • Pareto charts tutorial

Highlighting the vital few and hiding the trivial many

Sometimes a few tweaks to highlight the vital few problems and hide the trivial many can lead to increased clarity of the plots.

  1. On the Analyse-it ribbon tab, in the Pareto group, click Reorder.

    The categories panel on the analysis task pane is displayed.

  2. To sort the bars on all plots into the same order:
    1. Select the Sort all by same key check box.
    2. In the drop-down list, select JDH.
  3. To move a specific bar to the end of the list:
    1. Select the Keep specific category at end check box.
    2. In the drop-down list, select Miscellaneous.
  4. To combine categories:
    1. On the Analyse-it ribbon tab, in the Pareto group, click Combine.
    2. In the Categories list, select Electrode failure.
    3. Hold down the CTRL key, and select Bulb failure.
    4. Click Merge.
    5. In the Name column, alongside the category in the edit box, type Equipment failure.
  5. Click Recalculate.
Comparative Pareto charts

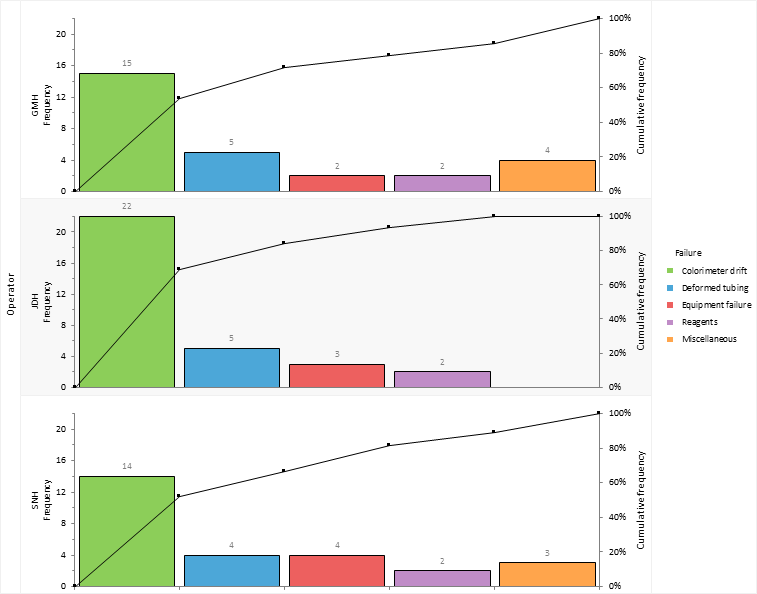
Miscellaneous problems are moved to the end of the Pareto plot. This is a sensible choice as this category comprises of all sorts of small unclassified issues that aren't of interest given the small amount of time they take up.

Problems are sorted into the same order as operator JDH who had the most total downtime making it easier to compare the plots.

Electrode failure and bulb failure are merged together into a new category named Equipment failure. These issues don't account for much downtime and resolving the problems isn't something achievable in-house without consultation with the manufacturer of the colorimeter.

Next topic: Monitoring improvements

  •  Tutorials
  •  Distribution tutorial
  •  Correlation / PCA tutorial
  •  Compare groups means tutorial
  •  Association in 2-way contingency tables tutorial
  •  Simple linear regression tutorial
  •  Bland-Altman method comparison tutorial
  •  Estimating the precision of a measurement procedure (CLSI EP05-A3)
  •  Evaluating the linearity of a measurement procedure (CLSI EP06-A)
  •  Verifying the precision of a measurement procedure against a performance claim and estimating the bias (CLSI EP15-A3)
  •  Pareto charts tutorial
  •  Identifying frequent problems
  •  Investigating stratification
  •  Highlighting the vital few and hiding the trivial many
  •  Monitoring improvements
  •  Sharing knowledge
  •  Process control charts tutorial
  •  Process capability tutorial


Version 6.15
Published 18-Apr-2023
statistics software, statistical software for Excel
  • Products
  • Store 
  • Support
  • Blog
  • About us
  • Download trial
  •  Search
  •  Sign in
  •  Contact us
Analyse-it editions
  • Standard edition
  • Medical edition
  • Method Validation edition
  • Quality Control & Improvement edition
  • Ultimate edition

  • Blog  
  • About us
  • Contact us  
  • Privacy policy


Copyright 2026 Analyse-it Software, Ltd, Leeds, United Kingdom .
We use essential cookies to run the site, and optional analytics to improve the experience for visitors. For more information see our Privacy policy.