Analyse-it
Analyse-it
  • Products
  • Pricing
  • Support
  • About us
Download trial Sign in
  • Tutorials
  • Pareto charts tutorial

Identifying frequent problems

An important first step in quality improvement is identifying the most frequent occurring problems.

  1. Open the file tutorials\Colorimeter.xlsx.

    The worksheet is open with some of the data hidden. We will use the additional hidden data later in this tutorial.

  2. On the Analyse-it ribbon tab, in the Statistical Analyses group, click Pareto, and then click Single Pareto Chart.
    The analysis task pane opens.
  3. In the Variable drop-down list, select Failure.
  4. In the Frequency drop-down list, select Downtime.
  5. Select the Label frequencies, Label cumulative frequencies, and Frequency table check boxes.
  6. Click Calculate.
    The results are calculated and the analysis report opens.

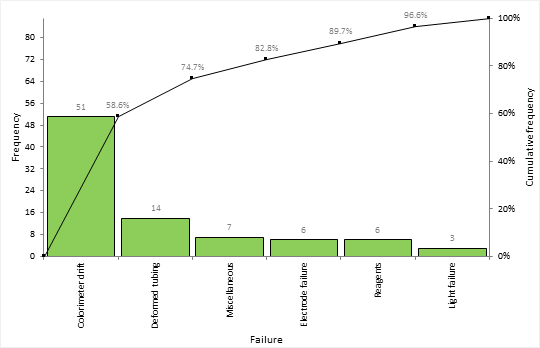
The Pareto plot bars show the amount of downtime spent fixing each failure sorted into descending order. A cumulative line shows the cumulative percentage of downtime.

Pareto chart
Based on the plot you can see:
  • 51 hours (60%) of downtime were spent dealing with colorimeter drift (for example, through recalibration).
  • Colorimeter drift and deformed tubing accounted for nearly 75% of all downtime.
Next topic: Investigating stratification

  •  Tutorials
  •  Distribution tutorial
  •  Correlation / PCA tutorial
  •  Compare groups means tutorial
  •  Association in 2-way contingency tables tutorial
  •  Simple linear regression tutorial
  •  Bland-Altman method comparison tutorial
  •  Estimating the precision of a measurement procedure (CLSI EP05-A3)
  •  Evaluating the linearity of a measurement procedure (CLSI EP06-A)
  •  Verifying the precision of a measurement procedure against a performance claim and estimating the bias (CLSI EP15-A3)
  •  Pareto charts tutorial
  •  Identifying frequent problems
  •  Investigating stratification
  •  Highlighting the vital few and hiding the trivial many
  •  Monitoring improvements
  •  Sharing knowledge
  •  Process control charts tutorial
  •  Process capability tutorial


Version 6.15
Published 18-Apr-2023
Products
  • Standard Edition
  • Medical Edition
  • Quality Control & Improvement Edition
  • Method Validation Edition
  • Ultimate Edition
  • Compare Editions
  • Pricing
Support
  • Documentation
  • Tutorials
  • Download latest version
  • Release history
  • Contact support
Company
  • About us
  • Blog
  • Contact us
  • Privacy policy

Get Started

  • Download free trial
  • Sign In

© 2026 Analyse-it® Software, Ltd. All rights reserved.

Statistical analysis and method validation software for Microsoft Excel.

We use essential cookies to run the site, and optional analytics to improve the experience for visitors. For more information see our Privacy policy.